
Good morning everyone! Thank you all for being here. We’re here today to talk about a transportation technology we think is on the ‘edge of innovation’,1 and that’s electric bicycles. My name is Ranek Kiil, and this is Keita Hill. We both go to the University of Alberta in Edmonton.
Today we’re going to take you through a little journey, starting with the history of different transportation technologies that we’ve seen in prevalent use, and going into a specific field: light electric vehicles. We’ll talk about why we find this to be a particularly promising area for innovation over the next decade or two. We’ll go into details on electric bicycles, how they’re constructed and designed, and then we’ll take a step back to look at the impact that a technology like the electric bicycle can have on communities, individuals, and society. After that, we’ll look at the opportunities, as well as some challenges and limitations, that we see people working towards overcoming in the space.
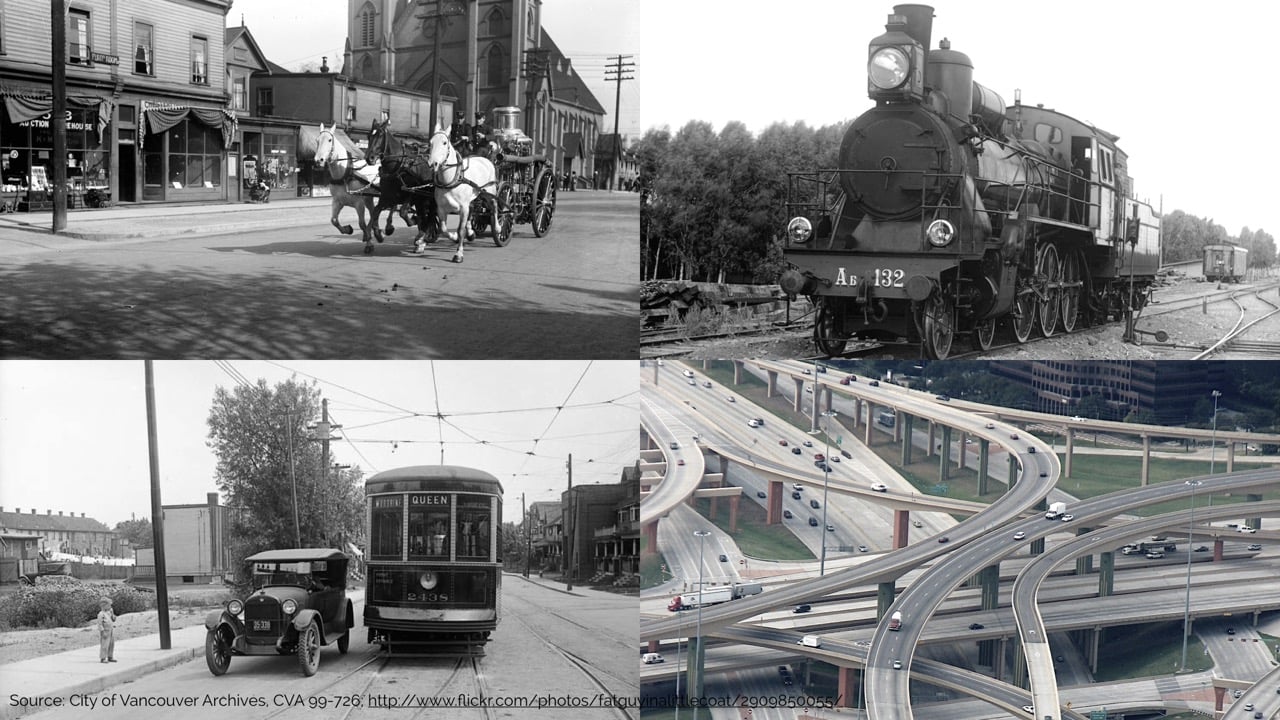
We’ll start with a bit of history. If we go back one hundred years, we find things like this fire truck, in Vancouver, in 1915. Up to that time, the only modes of transportation were basically walking, and horse-drawn vehicles. Since then, we’ve seen a huge transition in transportation modes over the last hundred years, first, through the advent of the steam engine and trains, and then the electric streetcar. Since the 1950s, we’ve been living in what urban planners might refer to as the freeway era or the Eisenhower era.2 This is a period defined by the private automobile.

When we take a look at the reasons why, we can see that this is because each mode of transportation that defines an era is the combination of a specific technology and a cheap energy carrier.
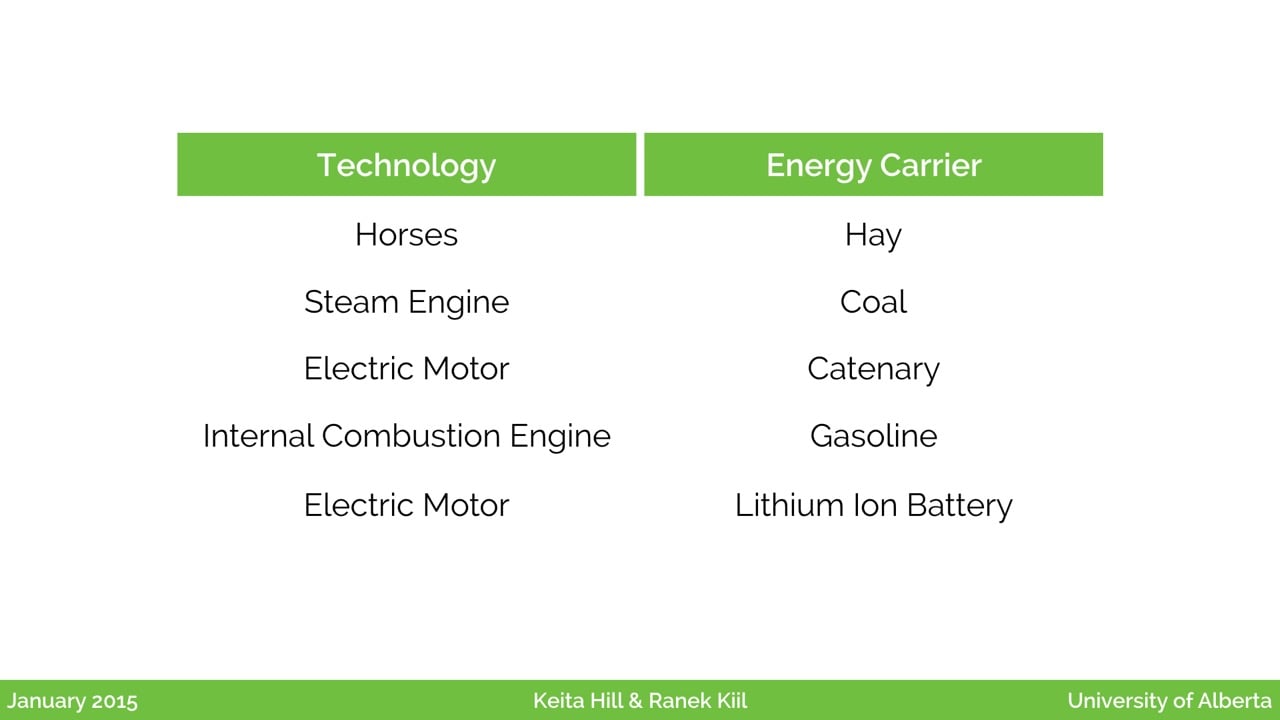
If we look at those five situations from before, we can see the energy for the horses being hay (or more directly, the energy in the horse’s metabolism); for the steam engine, there was coal; and for the early electric motors, there was the ability to connect directly to power via a catenary. Today, we’re living with the internal combustion engine, powered most commonly by gasoline. Lately, we’ve been seeing a huge increase in the density of lithium ion batteries. So now it’s possible to bring stored electricity with us in a moving vehicle. That’s creating brand new possibilities for the electric motor, which is otherwise a fairly mature technology by itself.
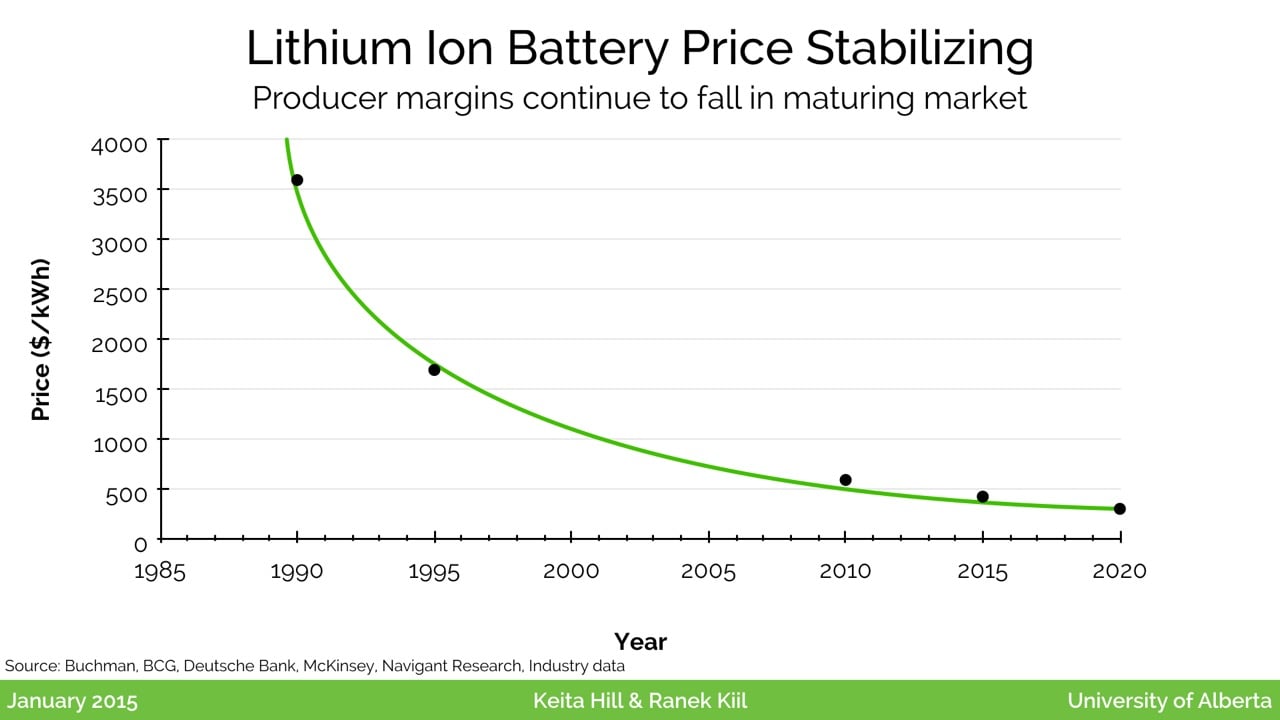
Of course, if you own a notebook computer, or a smartphone, you’ll understand the trend over the last couple decades, where the price of lithium ion batteries has been dropping, and is now starting to level off, at about $250 per kilowatt hour stored.
A lot of people, like the team at Tesla, are looking towards traditional vehicle form factors, like the automobile, and powering that with lithium ion batteries which run electric motors.
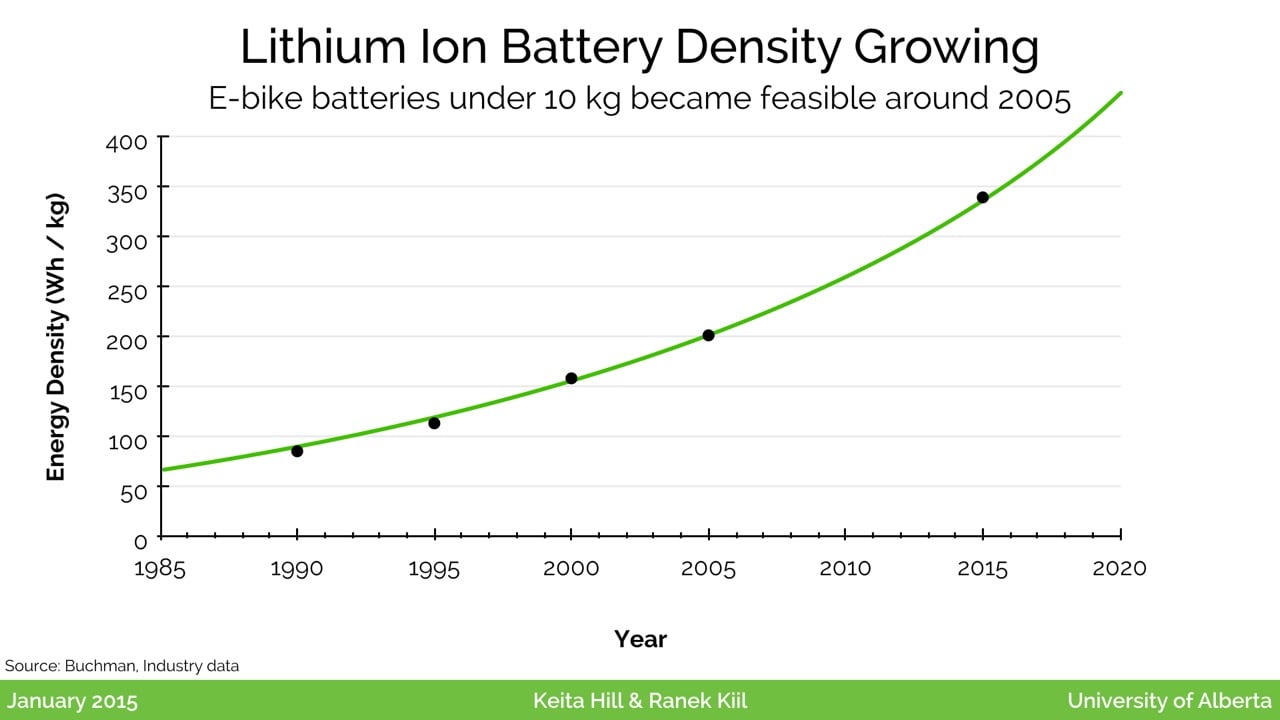
But say, if you own an iPhone, you might have noticed another trend: because of the increased density we’ve been seeing with lithium ion batteries, the size of battery that you used to need to get, say, ten hours of battery life, has been going down. This is part of how Apple has been able to continue to offer a full day of battery life as iPhones have been made thinner and thinner. The same trend is useful when looking at small electric vehicles. It used to be that a fairly heavy ten kilogram battery wouldn’t get you very far, but today that provides quite a bit of energy.
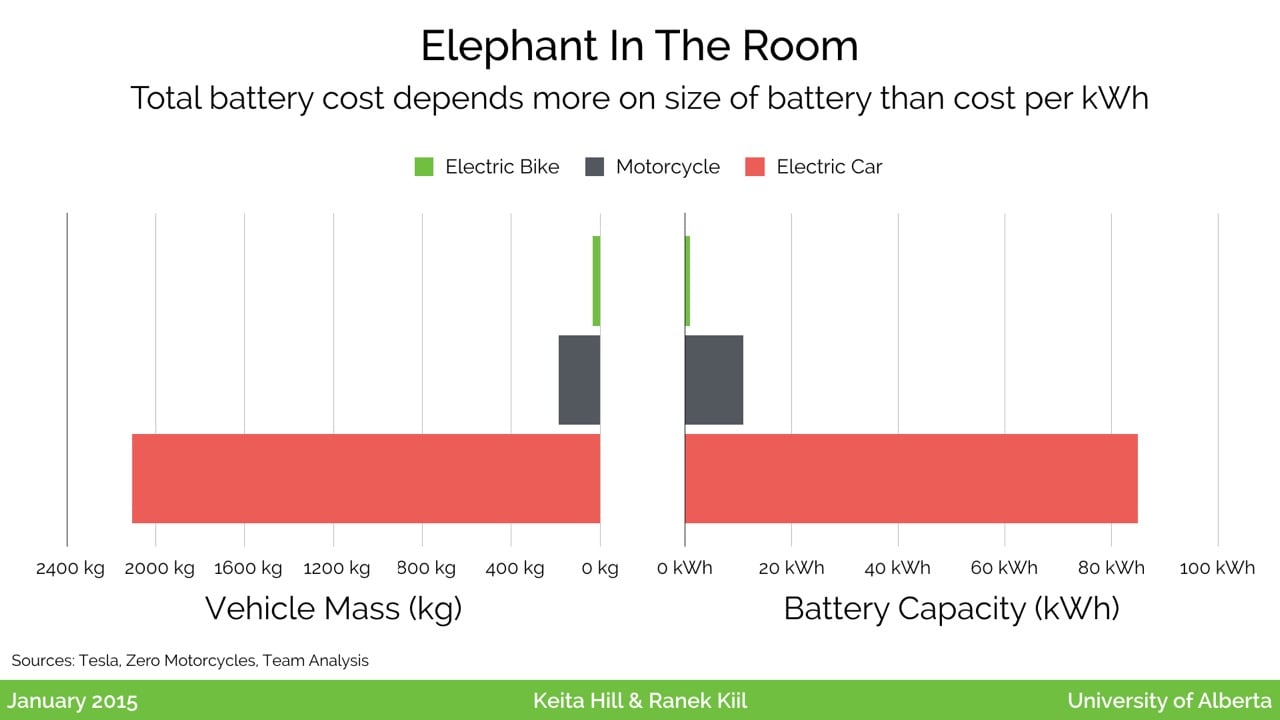
If you look at a landscape from small personal vehicles, up to full-size car, you’ll see that the mass of the vehicle has a huge impact on the necessary battery capacity required to get a useful range — for example of one hundred kilometres — to accommodate a typical commute.
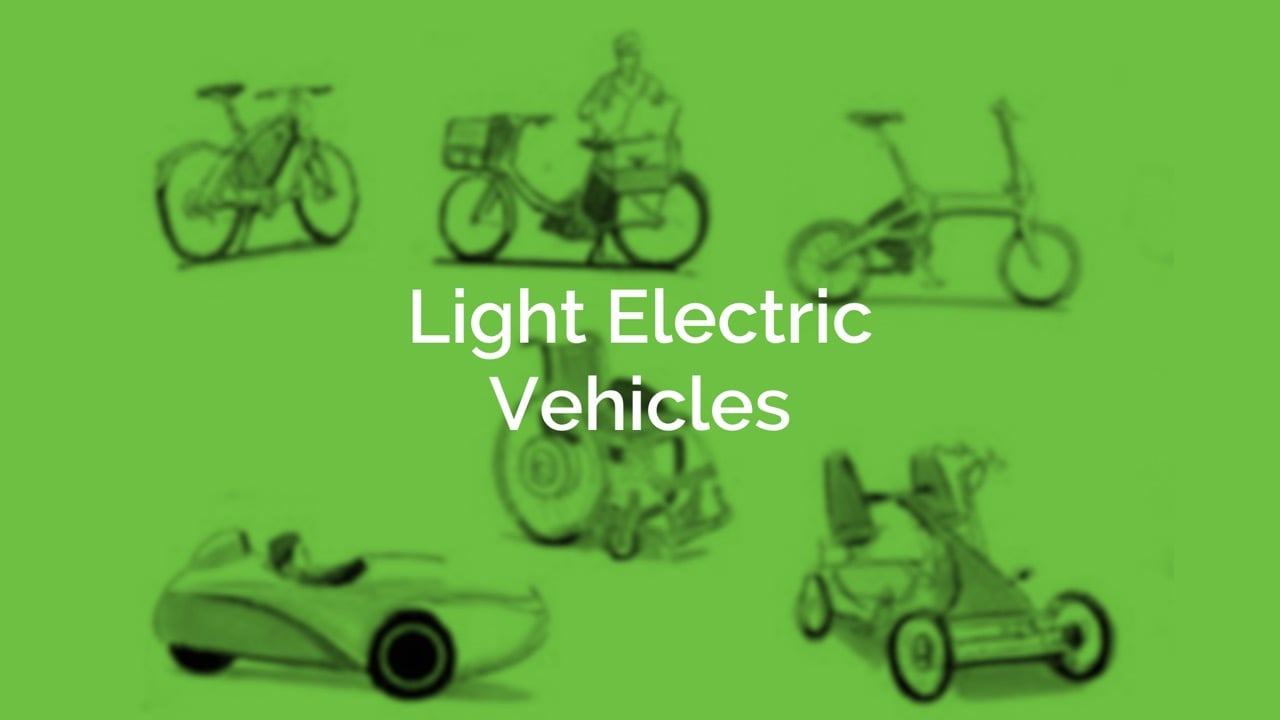
So, this raises the question: what’s a light electric vehicle? LEVs are a group of vehicles that are quite a bit lighter than a car, but are used by personal mobility. Typically this means one person at a time.
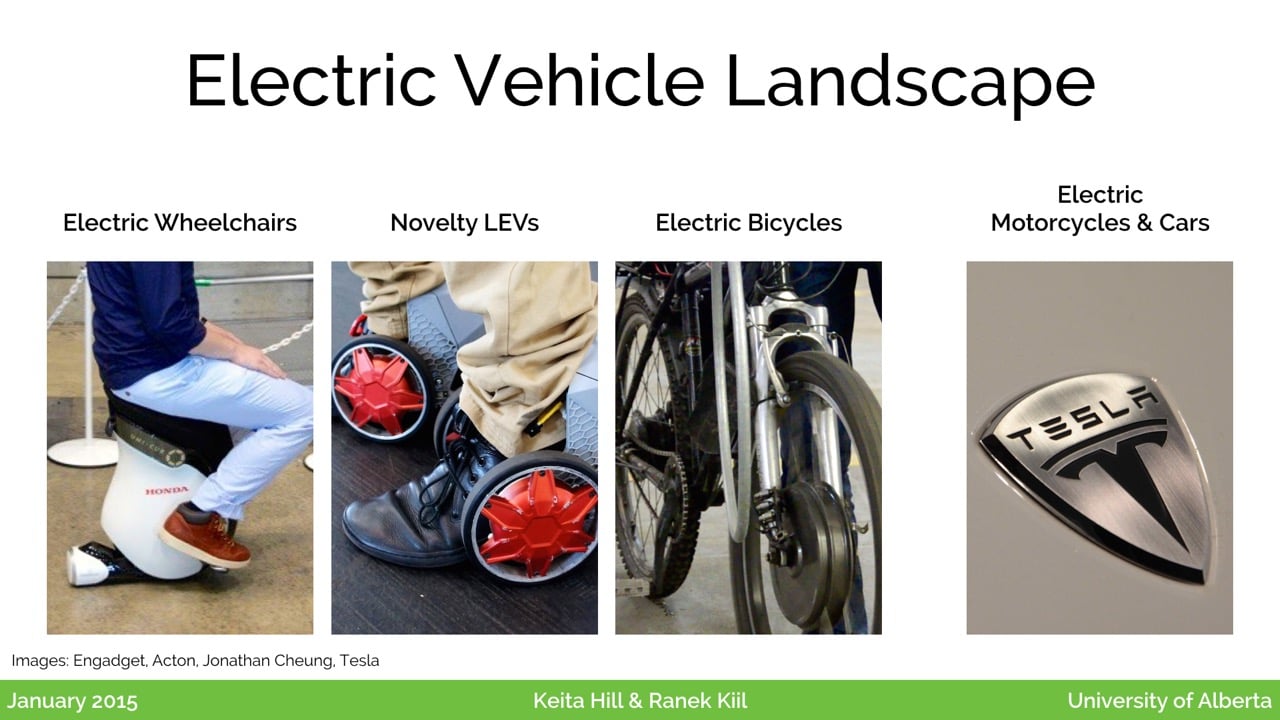
We looked at three major kinds of these vehicles. First we looked at electric wheelchairs. These have been around for about twenty-five years. They’re slower speed vehicles, typically used to aid people with mobility. Then we have novelty LEVs. These have been emerging over the last ten years or so. There are a whole variety of technologies here, from electric skateboards to electric roller-skates, and more. Finally, we looked at electric bicycles. We compared them across four major dimensions. These dimensions are speed, price, range, and time to learn. We benchmarked these for five different existing LEVs, and we’d love quickly run through each of them.
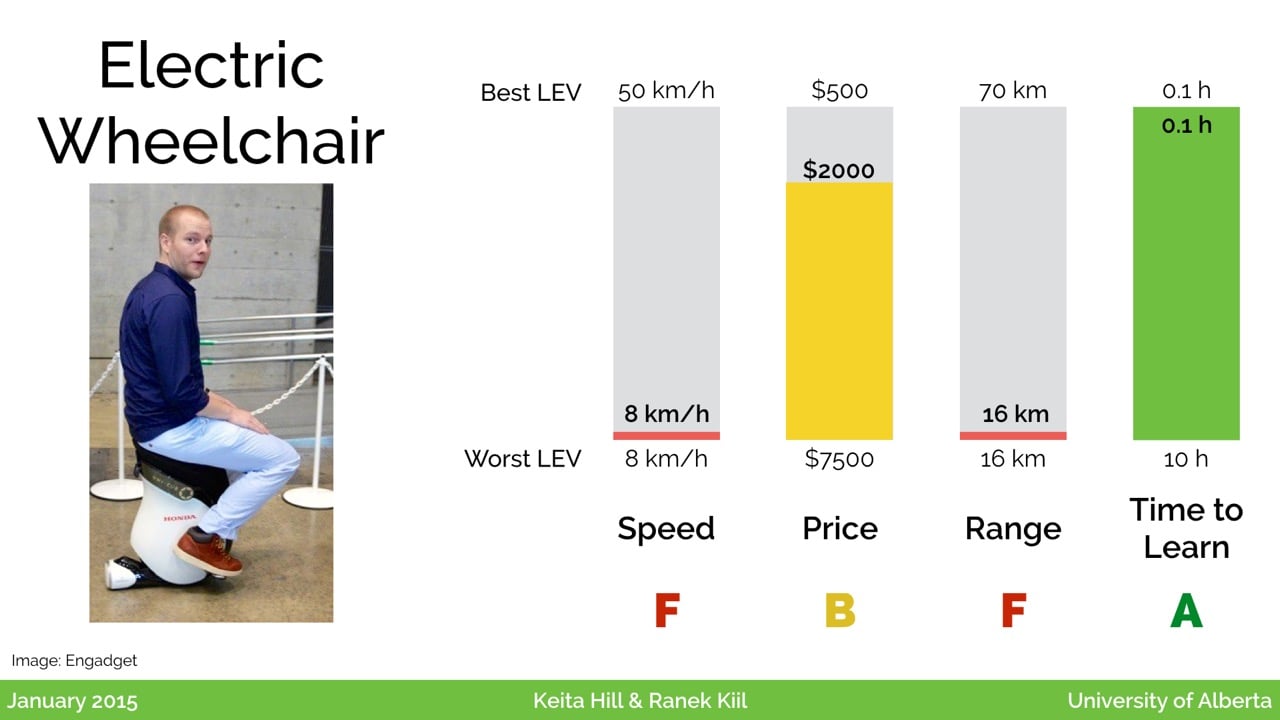
First up is the electric wheelchair. In this category, we’ve lumped a variety of personal assistive devices, including scooters, vehicles for people with mobility issues, and so on. A whole variety of vehicles fit under here. What we see if that these are very low speed, and have low ranges, which limit their possibility to be adopted by people who are otherwise unimpaired when talking or running. But they are very easy to learn, which is a big advantage.
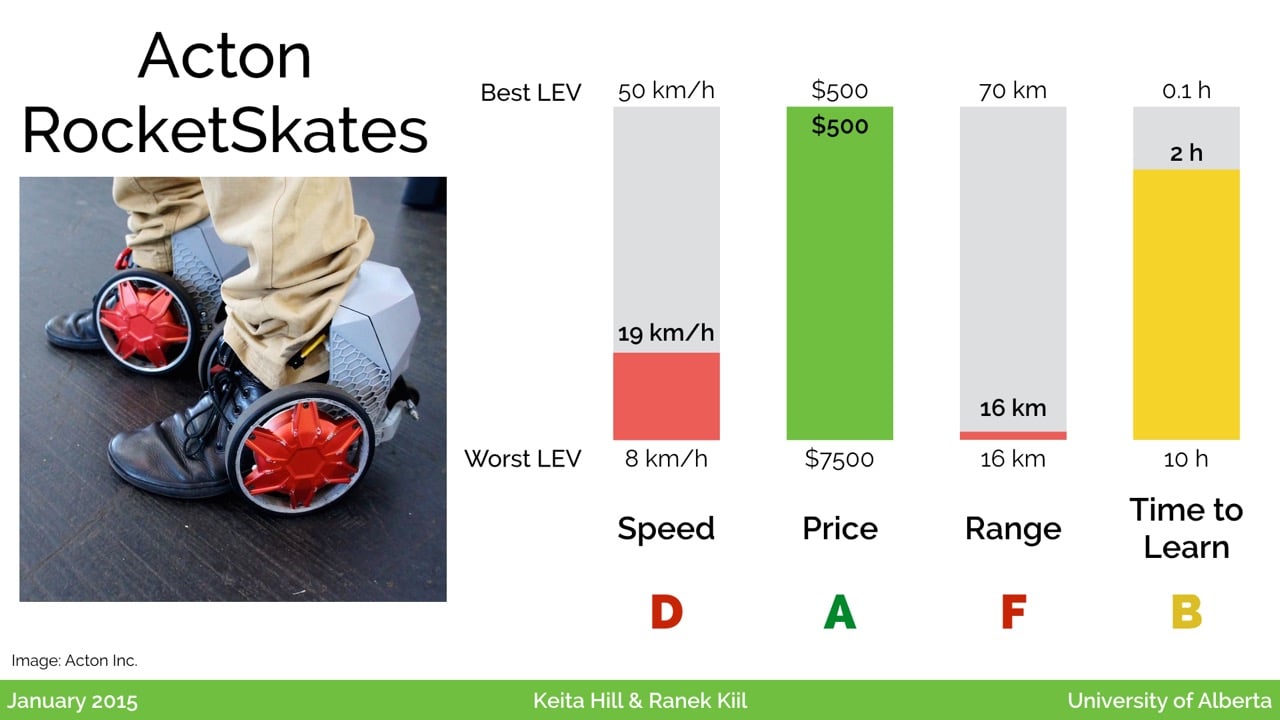
These are RocketSkates, a kind of electric roller skate. They take a fair bit of time to learn, but this specific example has been an innovator on price, and costs only about $500.
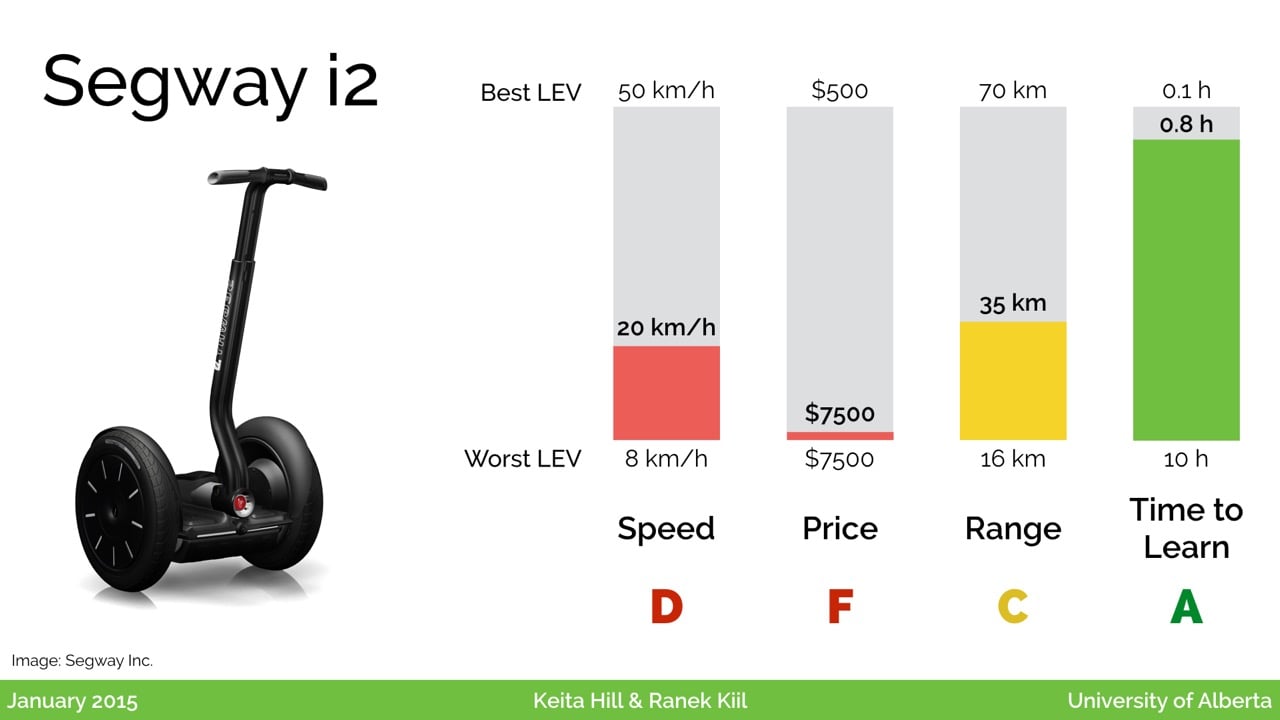
The Segway has been around for over 10 years, and the main issue with it is just the price point. However, it is fairly easy to learn, and the speed is decent.
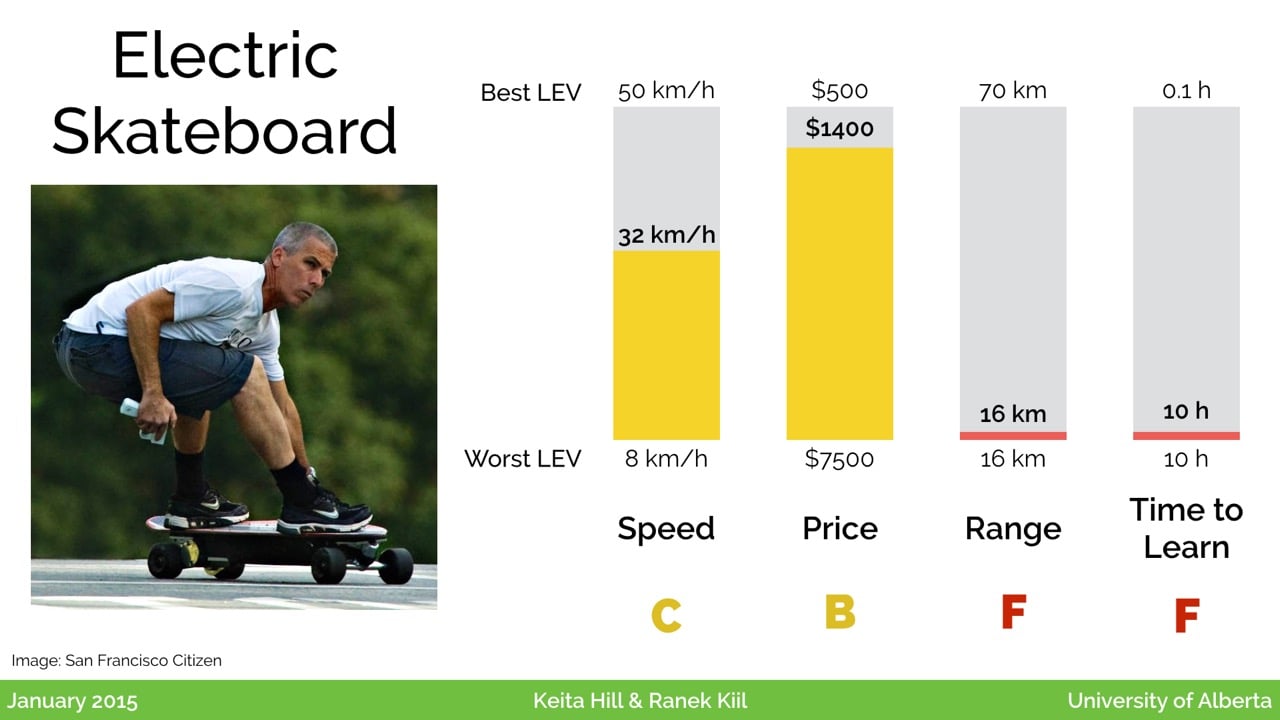
We looked also at some electric skateboards, which have also been around for about ten years. Some of these go over thirty kilometres per hour, but of course it takes considerable skill to ride one of these. We estimated at least ten hours to be confident riding these. But the prices are coming down, which is something we noted across several of what we’ll call “novelty” light electric vehicles.
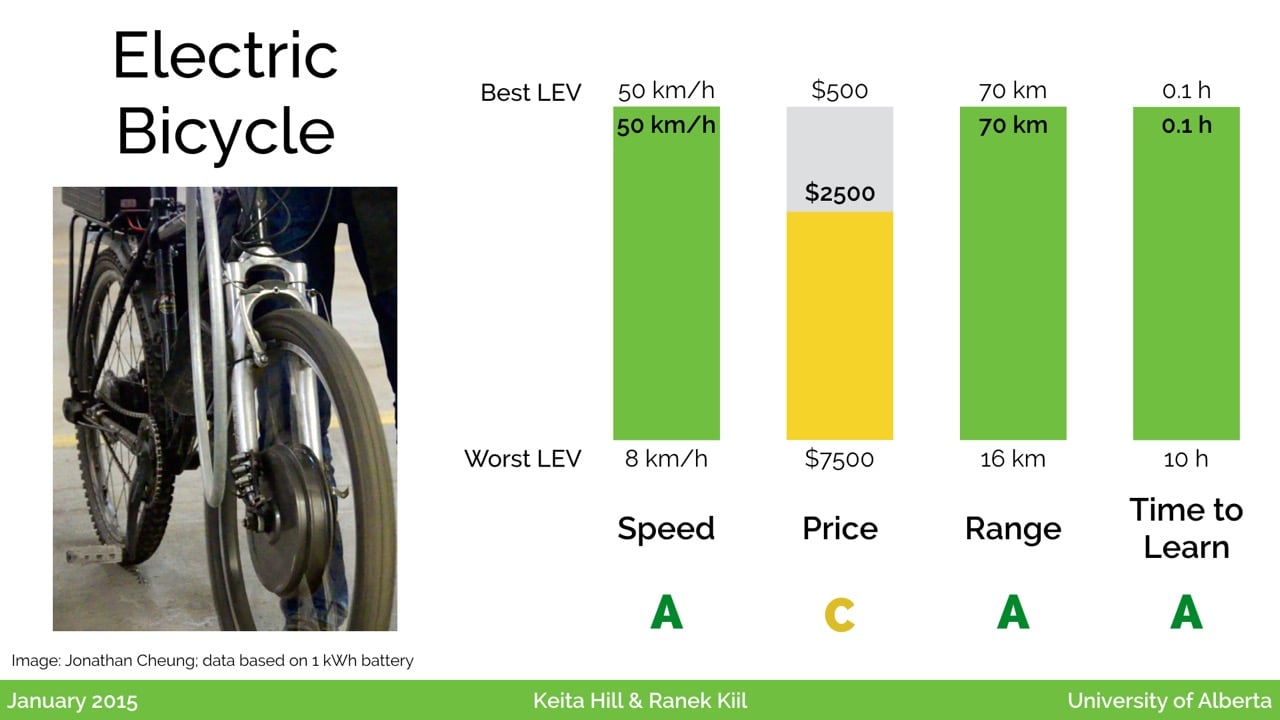
Finally, to look at the electric bicycle, we’ll note that it scores the best in several of these areas. With the bicycle form factor, you can build a vehicle that will go quite fast, up to fifty kilometres per hour. You can also get great range. And since many people already know how to ride a bicycle, the transition to the electric motor can be very quick.
Now Ranek will talk about the design that defines the electric bicycle.
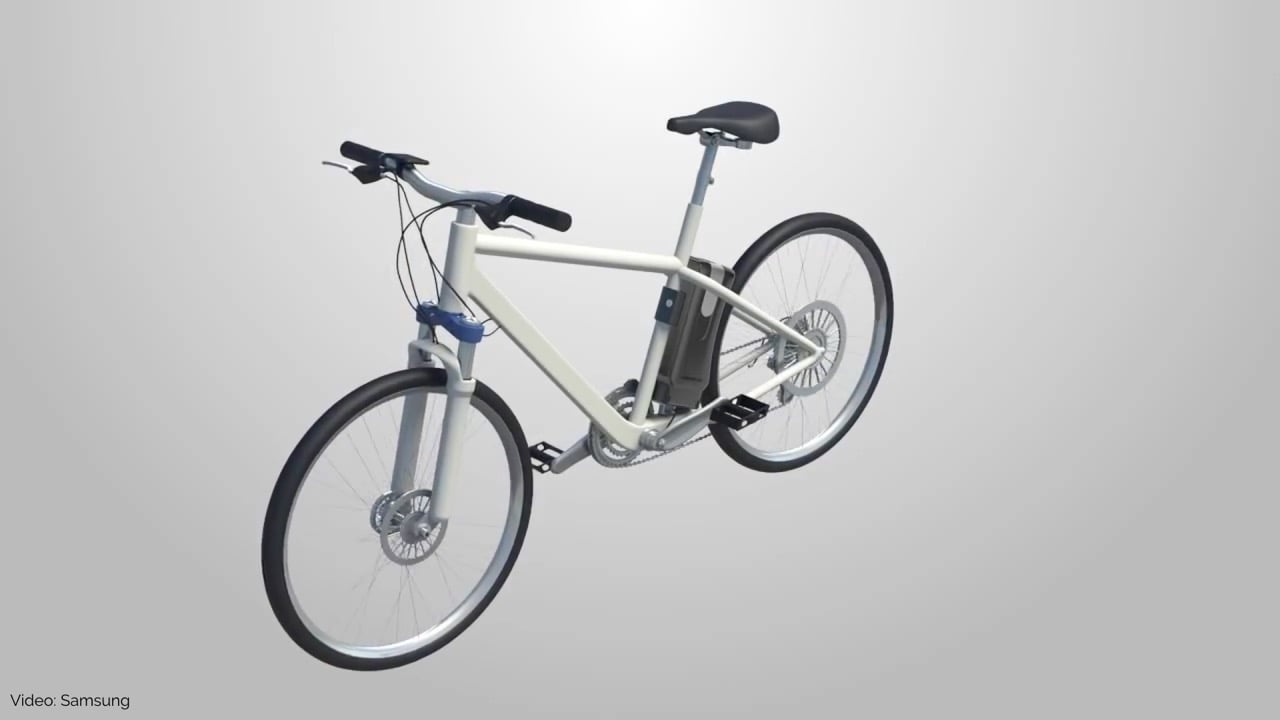
In this video from Samsung, we see an overview of the basic principle: to take lithium ion batteries, package them up, add some electronic components, and add the whole package to a regular bicycle. This might be the same sort of frame you’d find on any mountain bike, and it incorporates pedals and brakes just like you’d be used to.
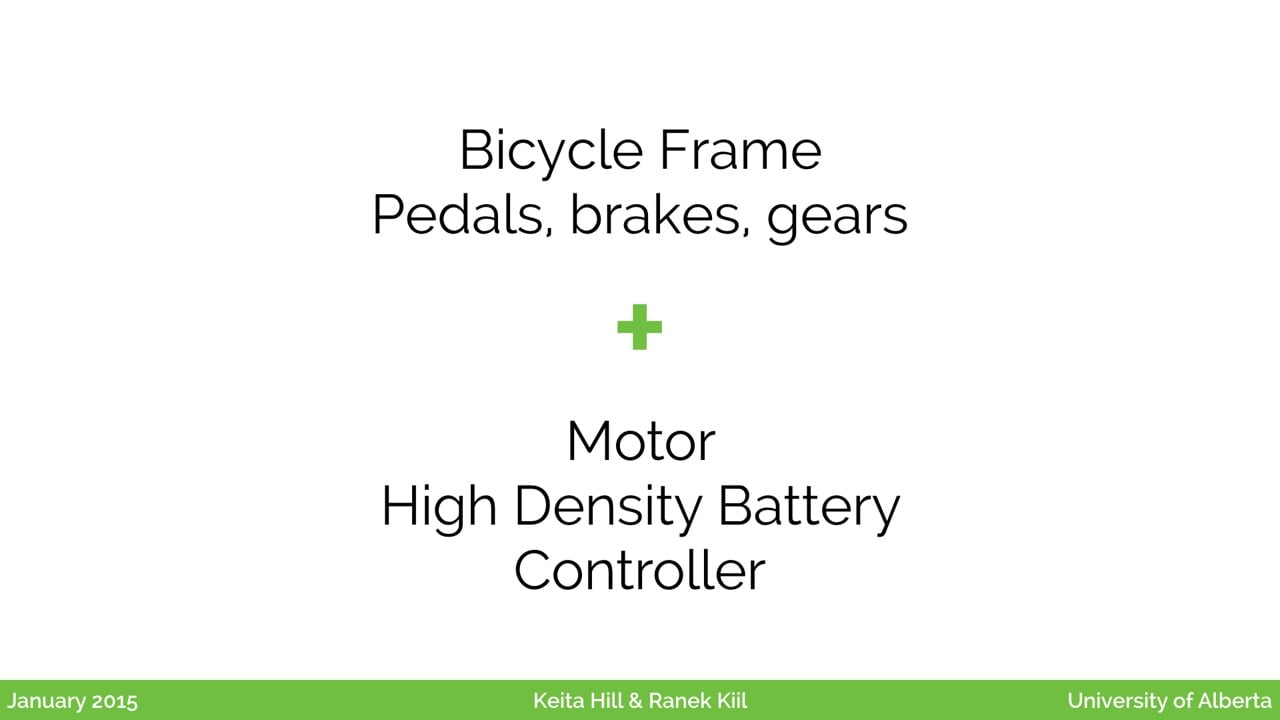
This is taking a well-understood technology that we’ve had for hundreds of years, and adding an electric motor and some high density batteries, along with some electronics.

We’ll take a quick step through these pieces. We’ve had bicycles for about two hundred years, and the modern frame design since the 1880s. A lot of research has gone into being able to withstand the forces mountain bikes go through, so that’s a mature technology.

Electric motors are also pretty mature at this point in time. Here we see a brushless motor that can ago around the hub of a bicycle wheel.
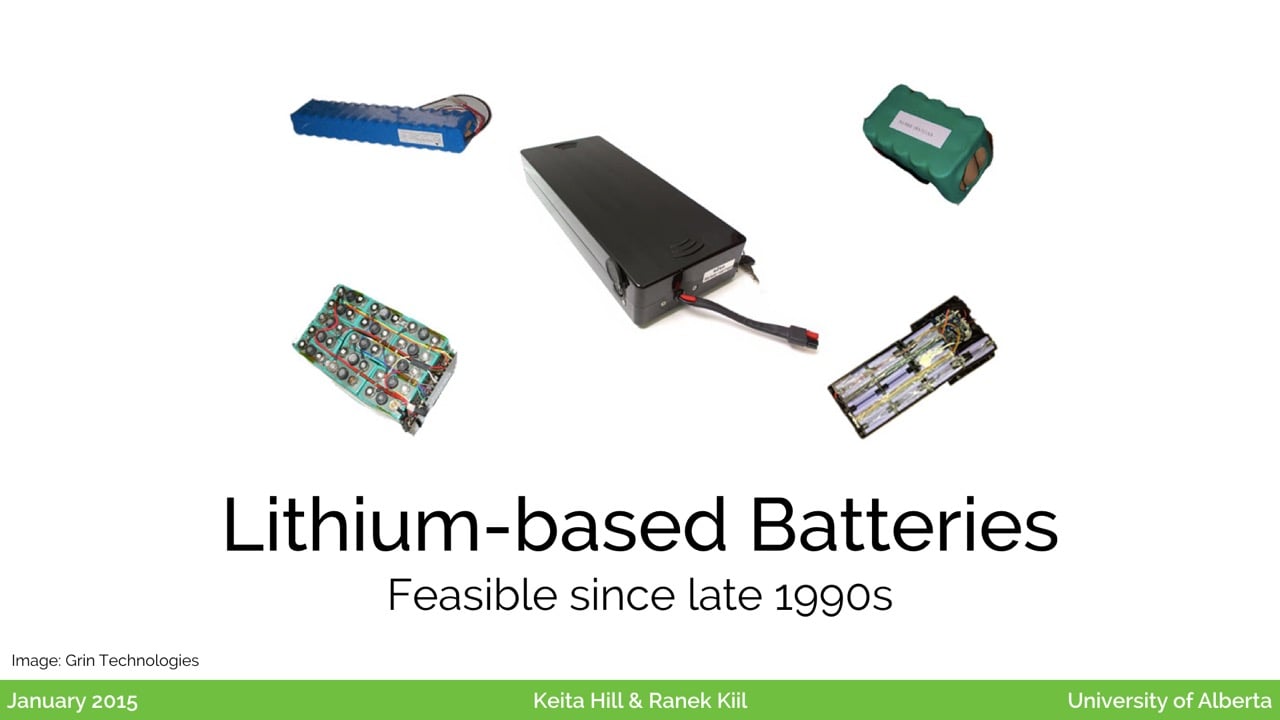
And of course, we add on the lithium-ion batteries, which are now high enough density and low enough cost that this sort of transportation form factor has been practical for perhaps a decade. These are the same sorts of batteries you might find in a notebook computer, just packaged into a higher capacity form factor.
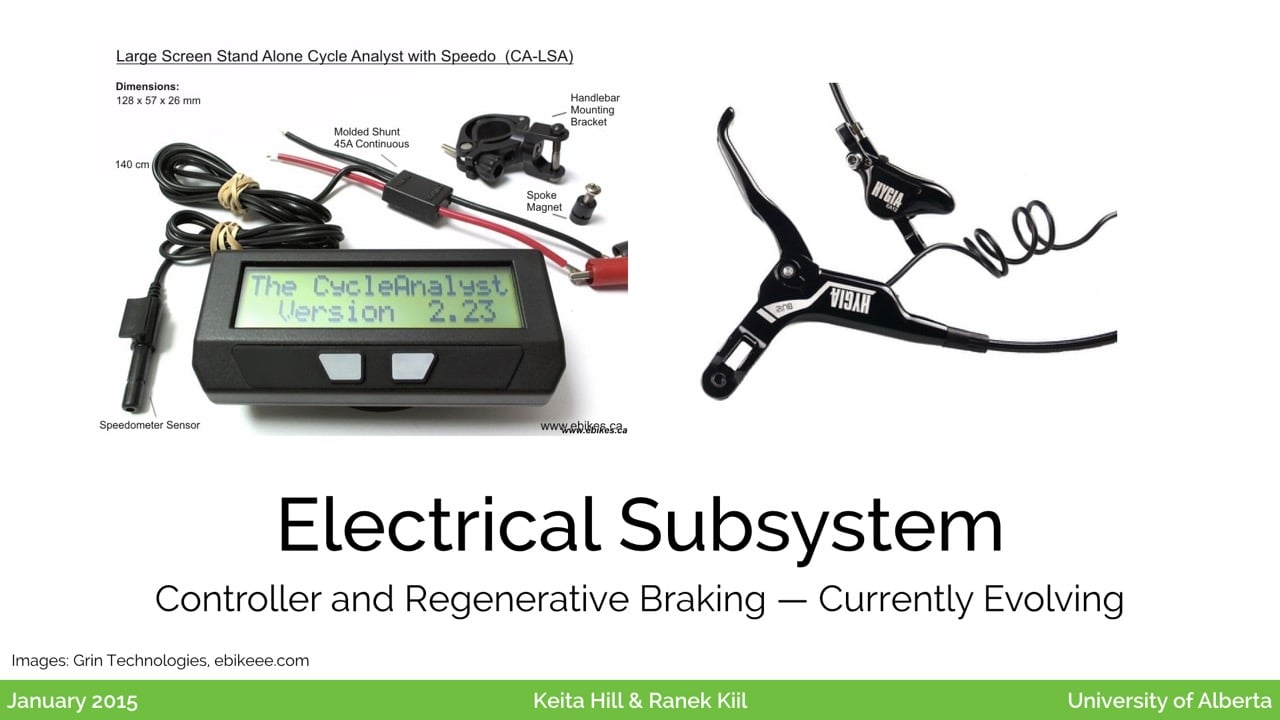
Finally you’ll have some electronics. Many bikes will report their current speed and the charge remaining. It’s also common to incorporate components to allow for regenerative braking; this way, when you need to slow down, some of the energy that would normally be wasted as heat can go back into the battery.
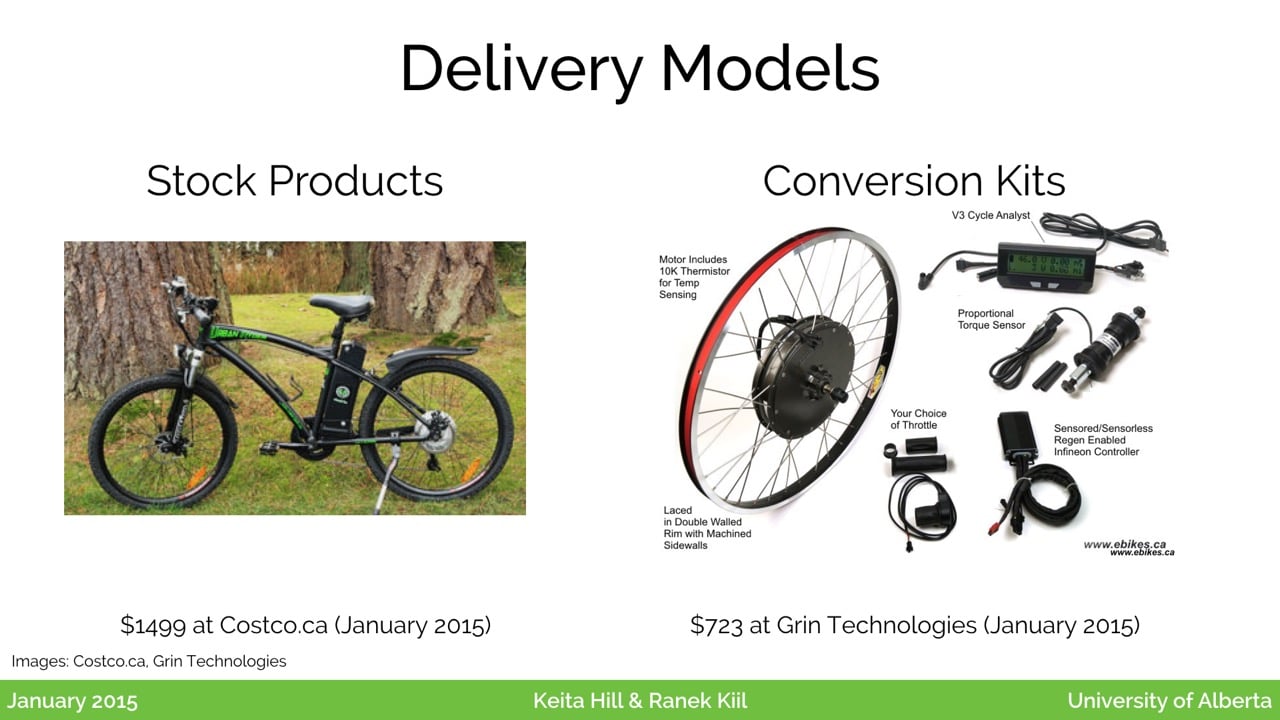
So there’re two major delivery models we’ve seen in electric bikes to date. These are stock products, and conversion kids. Stock products are where the frame, sometimes the entire bicycle, has been designed from the ground up with the intent of building an electric bike. Then there are conversion kits, which are quite interesting for anyone looking to electrify an existing bicycle. This amounts to adding an electric hub motor into at least one of the wheels. You can do front or rear-wheel drive.
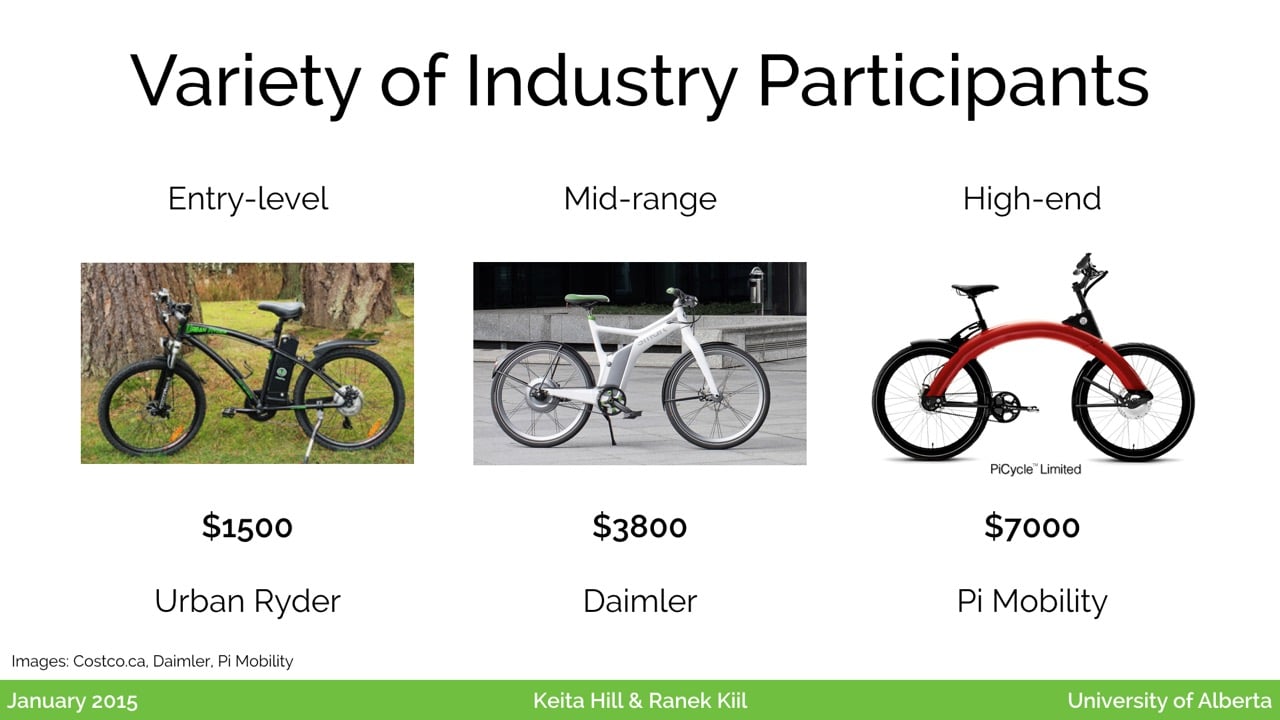
When we look at stock products that are available on the market today, there are a variety available here, even in Canada. The entry-level models are usually around one-to-two-thousand dollars; this is one model we pulled up just now on Costco.ca, so you can see some models entering this market. Then there are faster mid-range models, many of them from California or Europe.
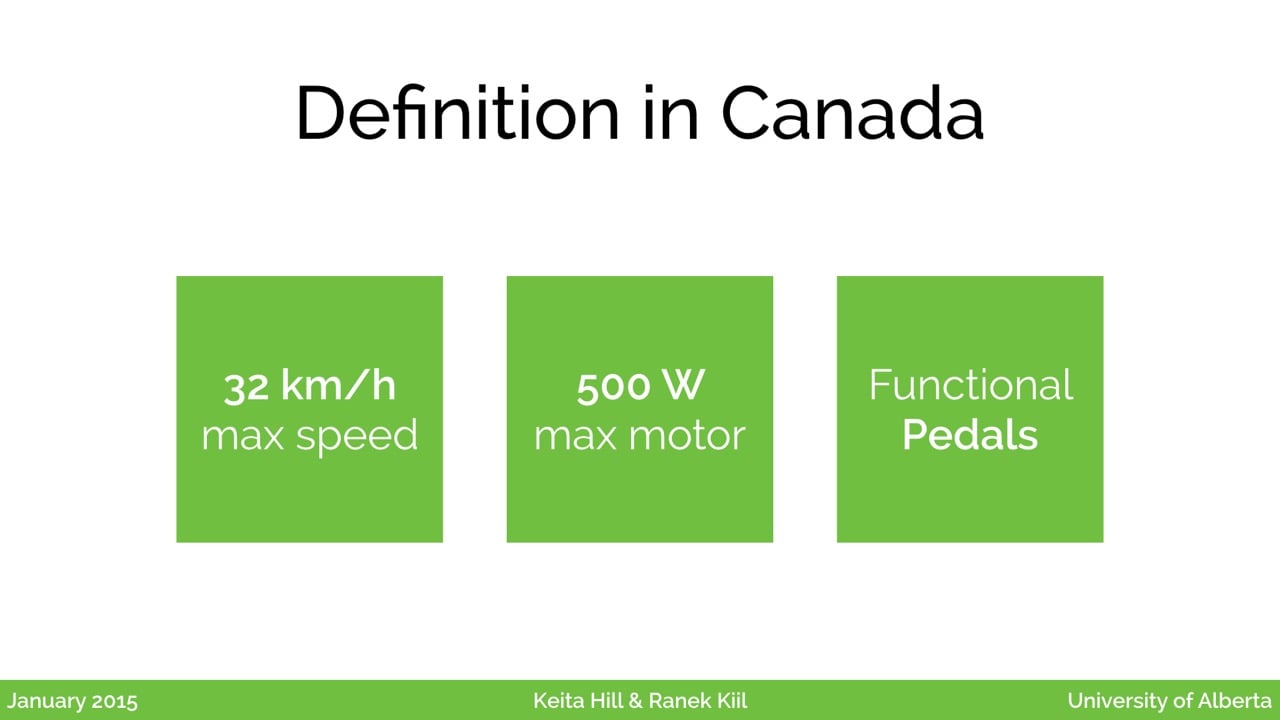
Now it’s important to note that these products, if they are to be presented as electric bicycles, have to follow certain legislation. In Canada, that means a speed of thirty-two kilometres per, a five-hundred watt motor, and the bicycle must have functional pedals. That means, it must be possible to ride the bicycle with the pedals alone.
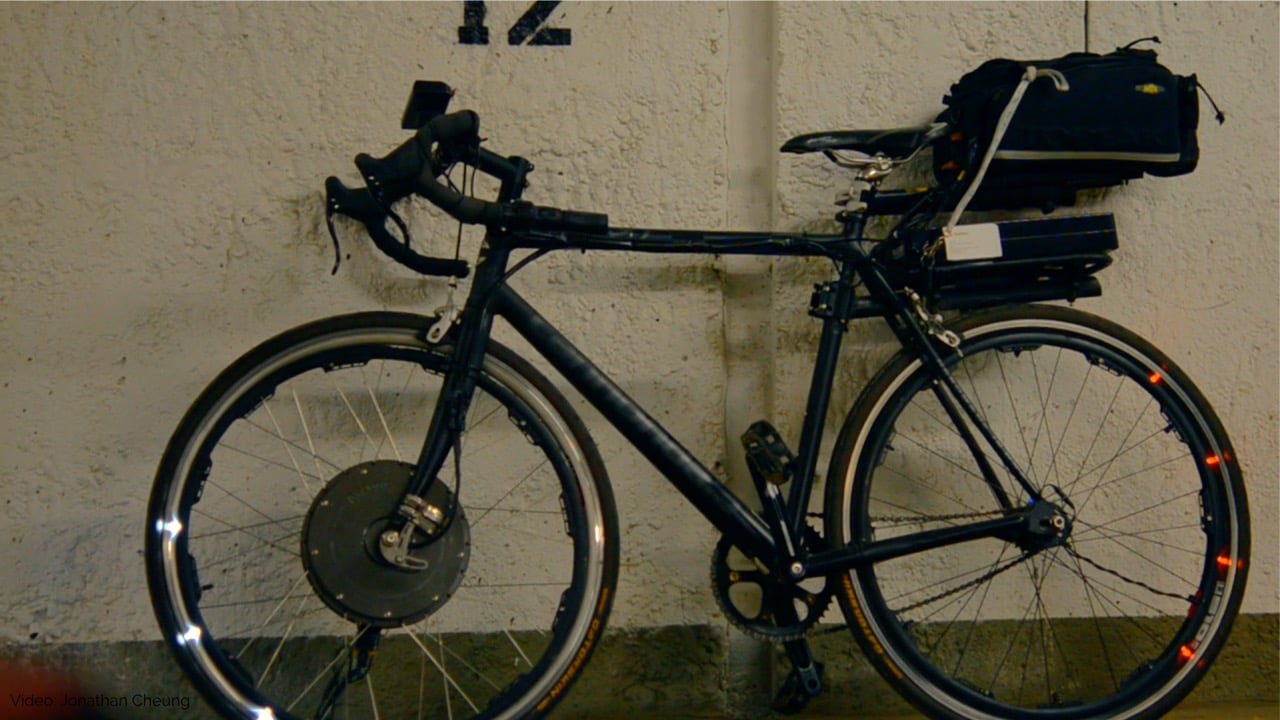
If you look at some of the conversion kits, you can see a bike that I actually converted. There’s the electric hub motor there, some integrated lights that are powered off the main battery, and you can see where the battery pack sits, there at the back. This bicycle also has a display that shows you the current speed as well as the remaining battery capacity. Here we can see how that responds when you operate the bicycle, as well as what it looks like to operate it in Edmonton’s winter. So you can see it’s still like a regular bicycle, just with some additional power added to it from the electric motor.

So this brings a lot of opportunities for bicycles in our communities, which Ranek will talk about now.

We’ve used the concept of community3 to break down some of the different factors that are important to consider when looking at the adoption of a new technology. So there are impacts on society in terms of environmental impacts, social impacts, and the impact on individuals, which can often be quantified economically. Of course, that’s a critical part when it comes to the actual chance of a technology being adopted — to a large extent, people make personal decisions in isolation, and we want to hope that the sum of those decisions pushes us forward as a whole, but of course that doesn’t always happen if other technologies with more damaging externalities are much cheaper.
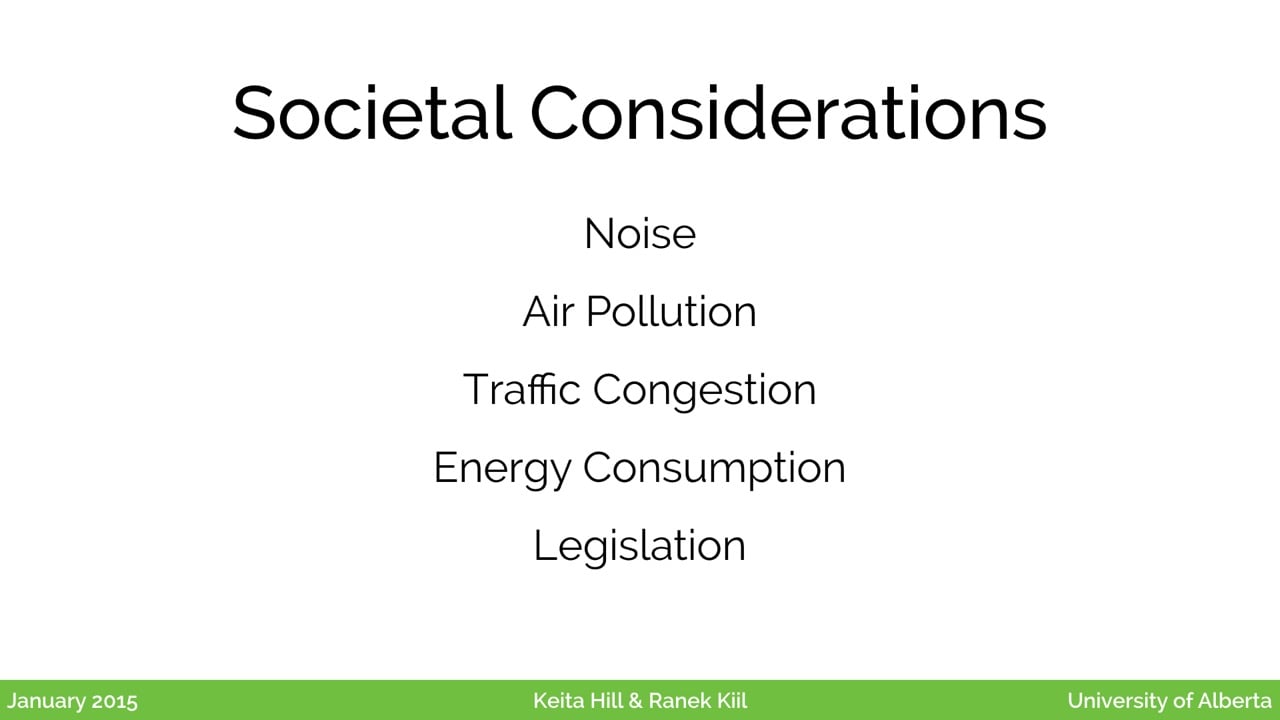
We also looked at noise pollution, traffic congestion, and other things caused when people choose a particular size of vehicle. Of course, there is energy consumption, and then there’s the whole legal framework that Keita started to touch on in terms of defining what types of vehicles there are, where you can ride them, and so on.
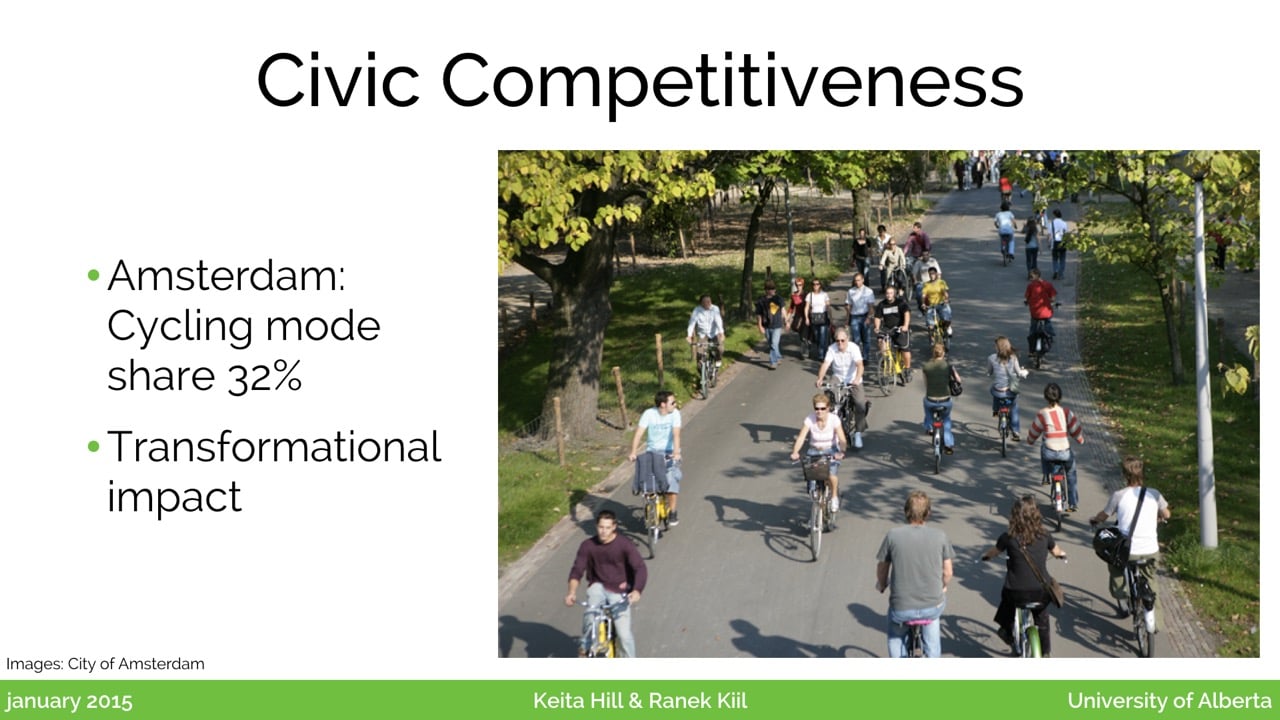
Another factor we looked at was civic competitiveness. These days, cities are looking to attract and retain talent, and the way that cities present themselves and the plans that they make, serve not only a legislative purpose, but also impact how a community grows. For example, in Amsterdam, about a third of trips occur by bicycle, and this has had a transformational impact on that city. It improves the perception people around the world have of Amsterdam, and it also improves the health and happiness of people who live there.
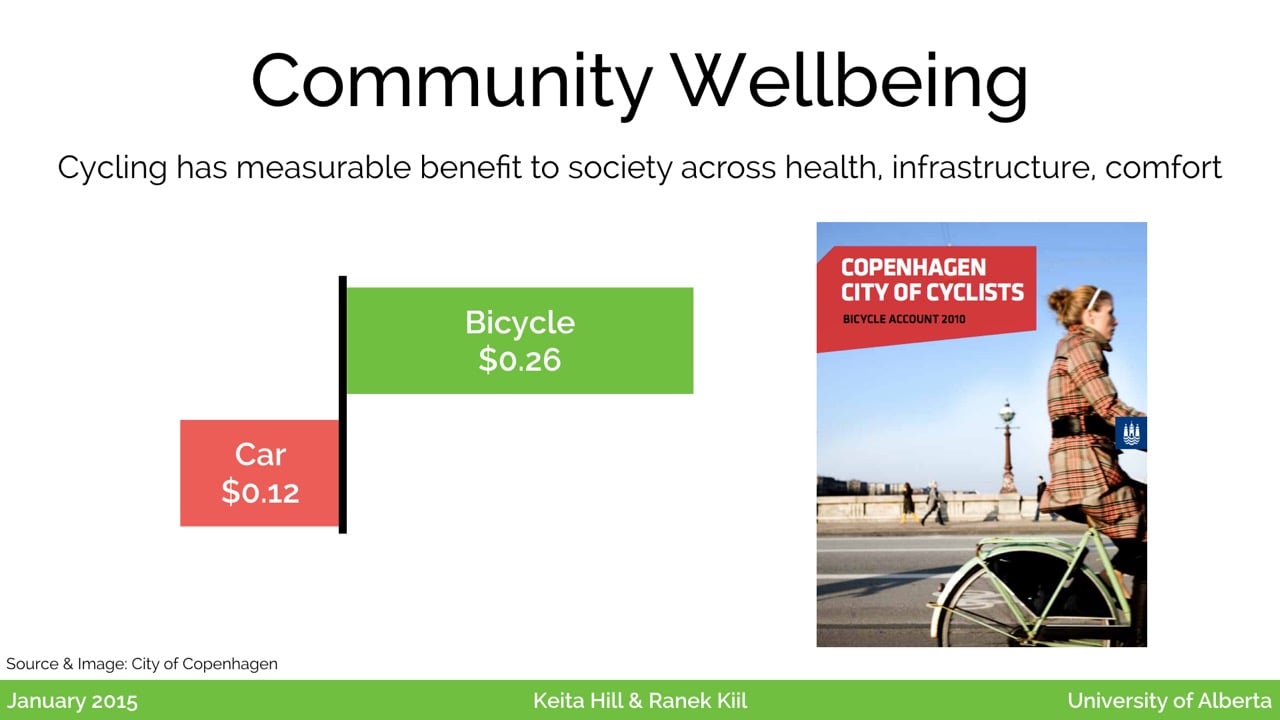
Not far away, in Copenhagen, a study tried to quantify the externalities associated with choosing different forms of transportation. They added lots of factors together, including costs of infrastructure and health care, comfort, and more. They found that for every kilometre cycled, the external net benefit is around 26¢. This is compared to a cost to society for every kilometre in a car of about 12¢. This means that every kilometre switched from car to bicycle has a big benefit to society as a whole.
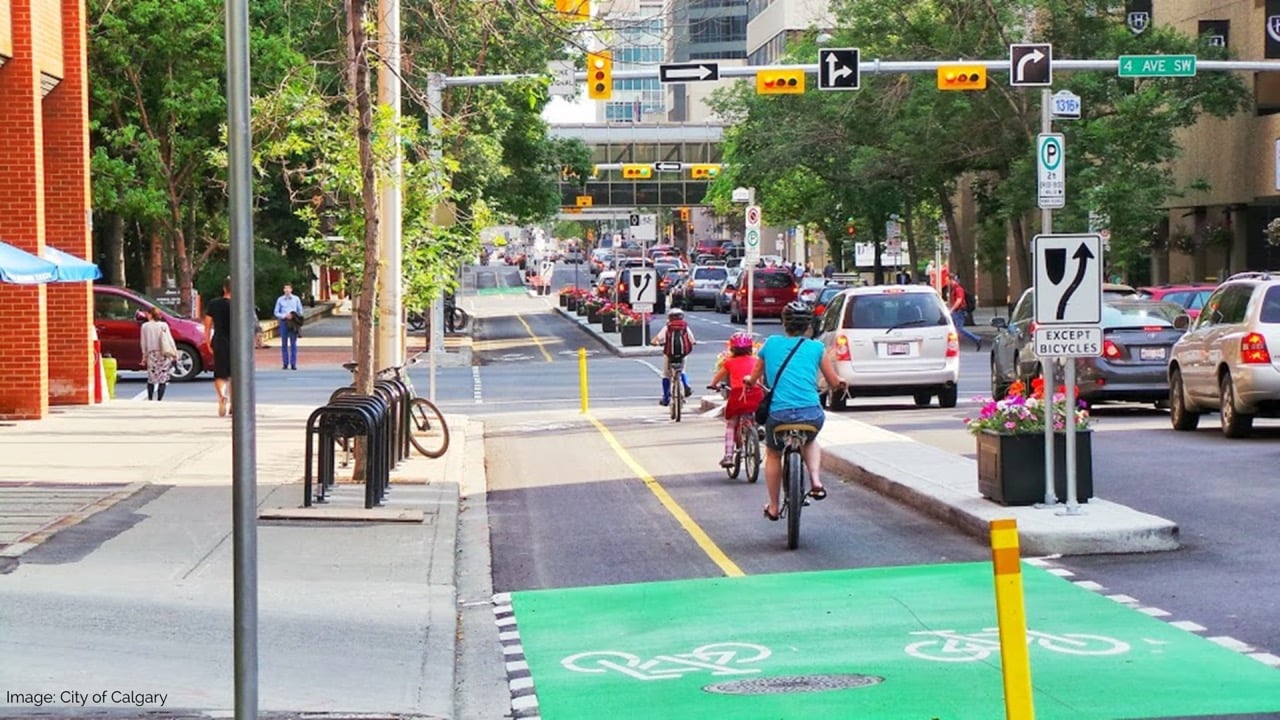
Canadian cities have taken notice. This is a photo from Calgary, but is probably a familiar scene from people in any major Canadian city. There are bike lanes being added along existing modes, sometimes even separated, and nearly every major city has a transportation plan that includes cycling as a major component. But we haven’t seen any city dealing specifically with electric bicycles or other technologies that help push the envelope on how far people can travel using technologies other than an automobile.

We find this a little bit surprising, especially considering how much rhetoric goes around about retaining creative people and professionals. For us, as engineering students in our last year, we anticipate having a lot of flexibility in terms of where we choose to work, live, and eventually raise a family. This makes it very important for cities to remain competitive. Some of the factors people consider when choosing a city include a sense of belonging and shared values, and today that often means providing a sustainable environment.
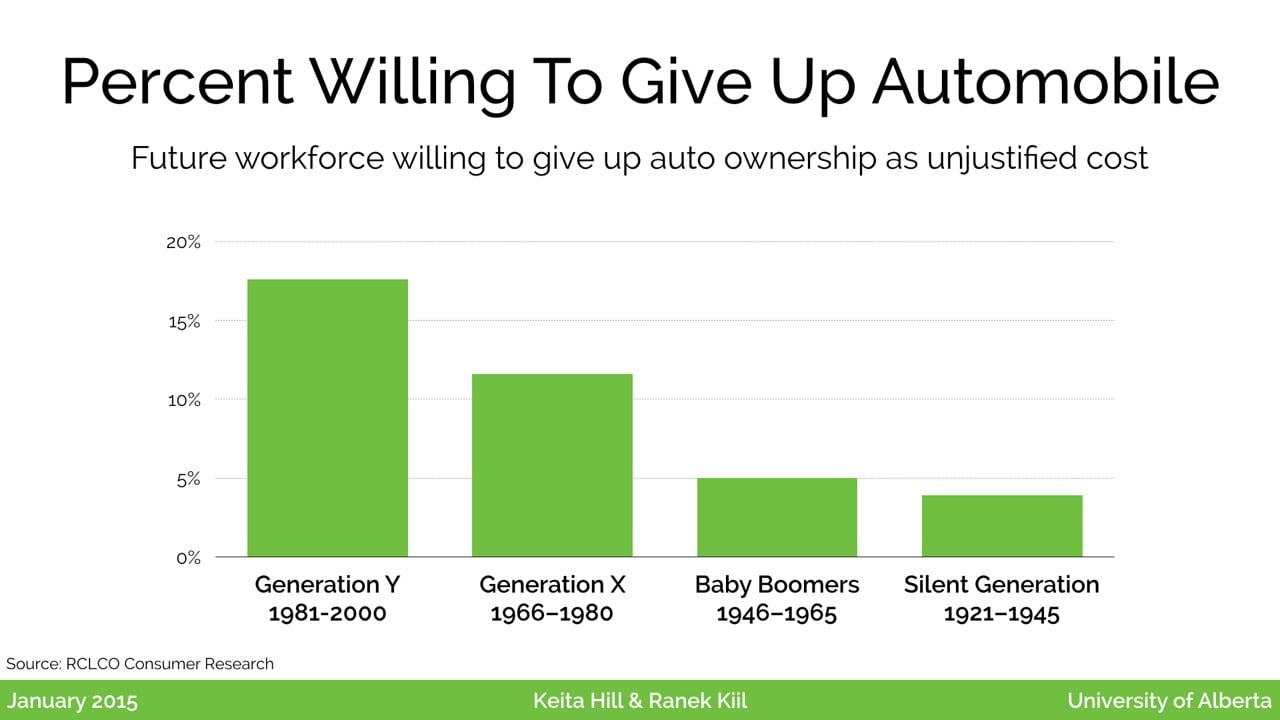
There’s also the generational factors to consider. If we look at the folks born after 1980, we see the largest willingness ever to give up the automobile. About a fifth of this generation says in surveys that they find the automobile to be an unjustified cost and are very eager to adopt alternative forms of transportation if available to them.
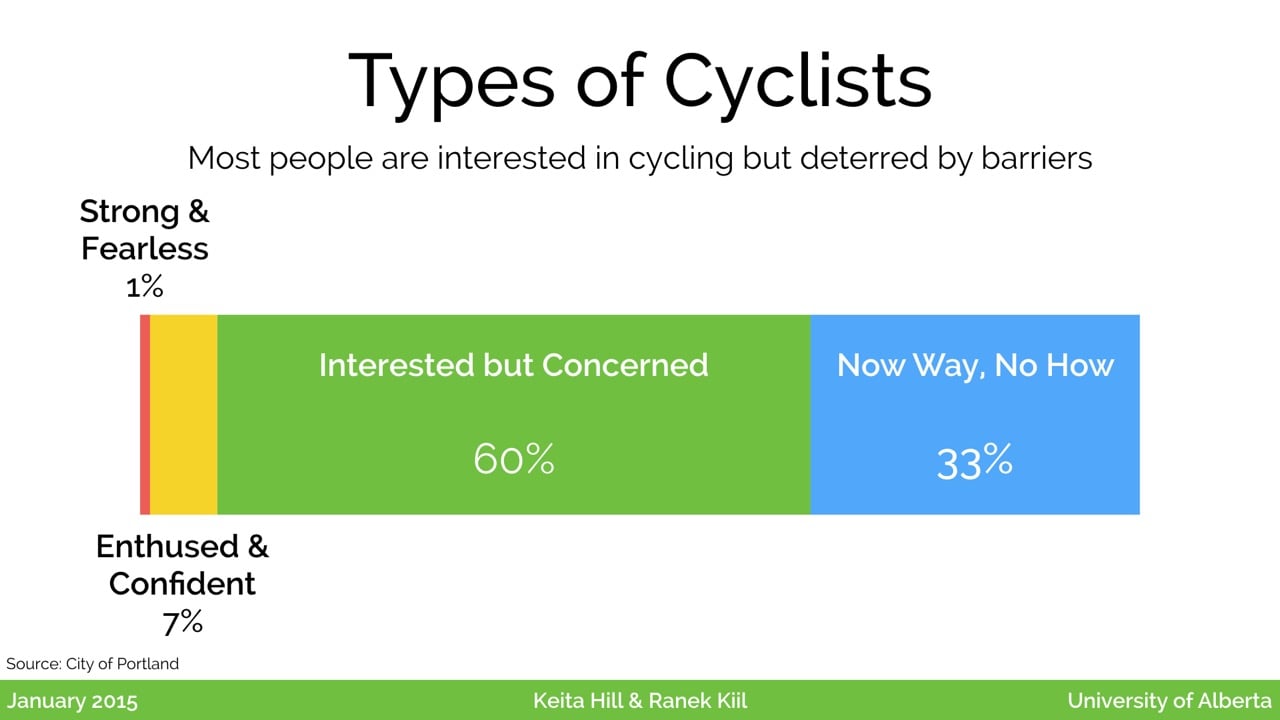
This is another study, from Portland, that tried to break down the types of cyclists. They found that one group will cycle all the time, the die-hard fanatics. There are also about a third of people who don’t report any interest in cycling. But in the middle there is a large group, about 60%, who don’t cycle often, or only cycle recreationally, but are interested in cycling more, and perhaps even commuting by bicycle, but have barriers in their way. This provides context for looking at electric bicycles and how they can help deal with some of the barriers that exist.
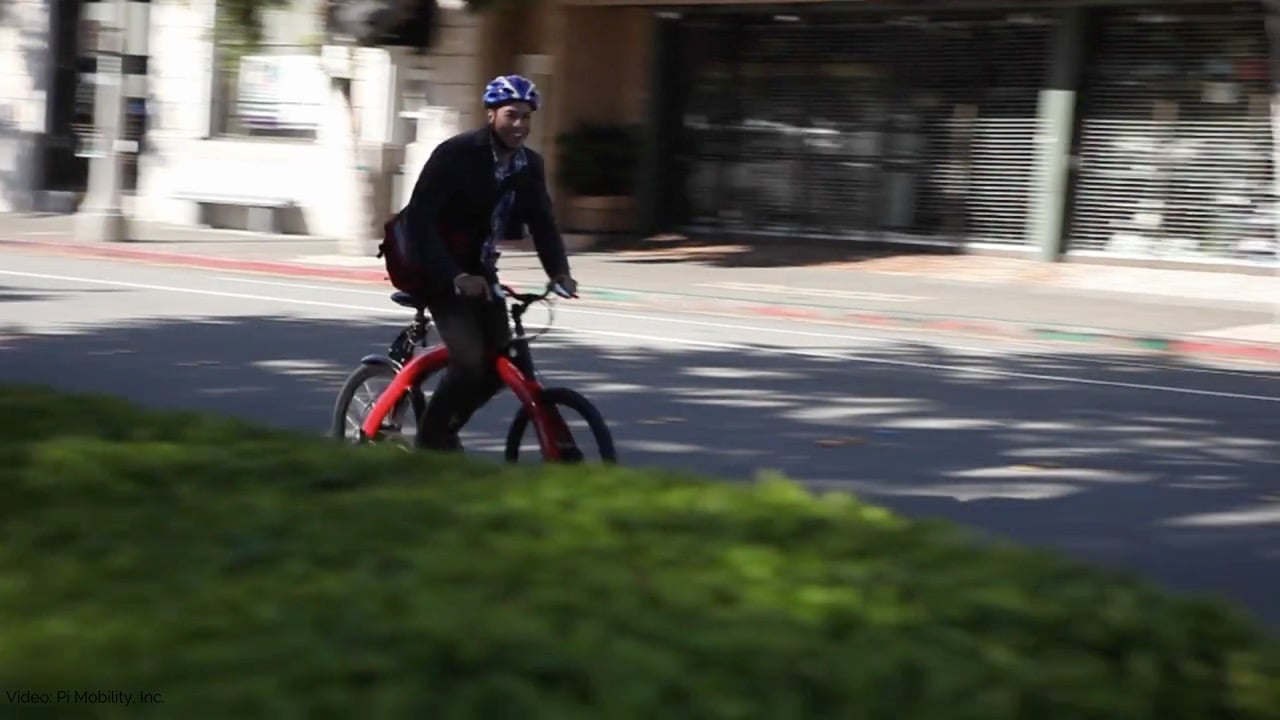
In this video from Pi Mobility, we can see how quickly the cyclist is able to accelerate and keep up with traffic, which is a very important factor in the ebike’s adoption potential.
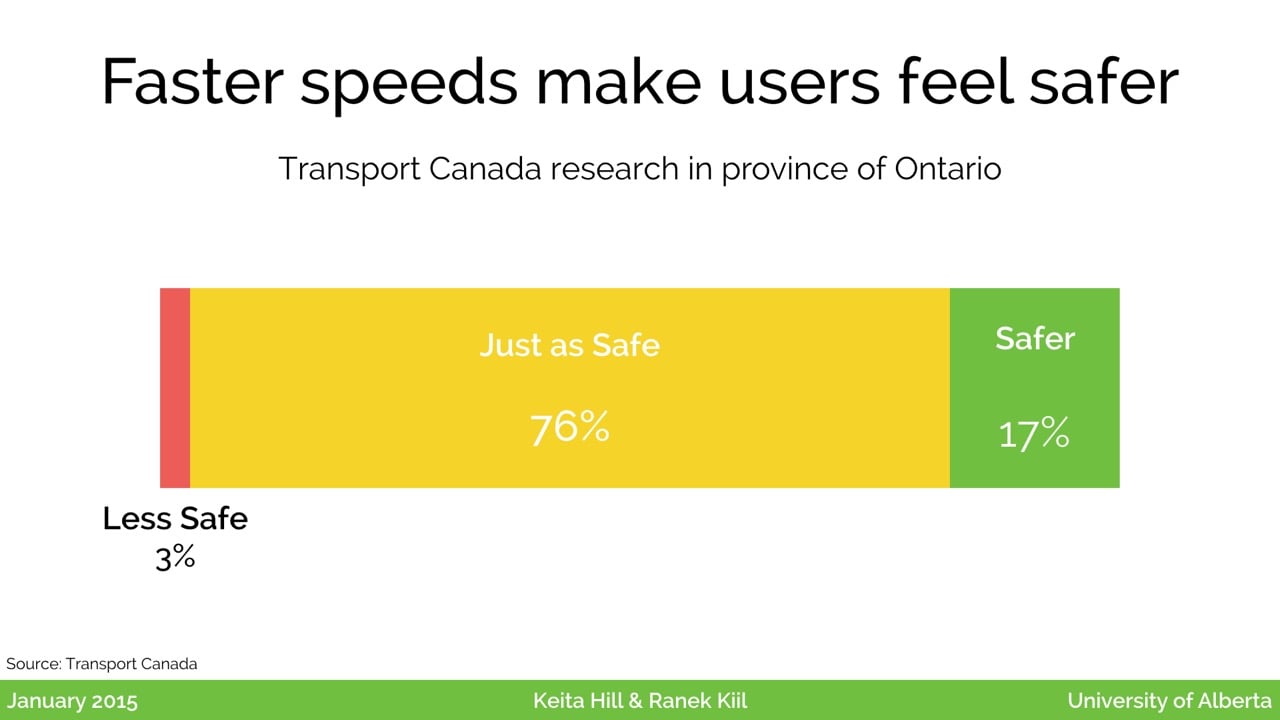
Transport Canada was ahead of the curve when they did this study, that put people in traffic on a regular bicycle, and on an electric bicycle. The vast majority felt safer, or at least just as safe, on the electric bike.
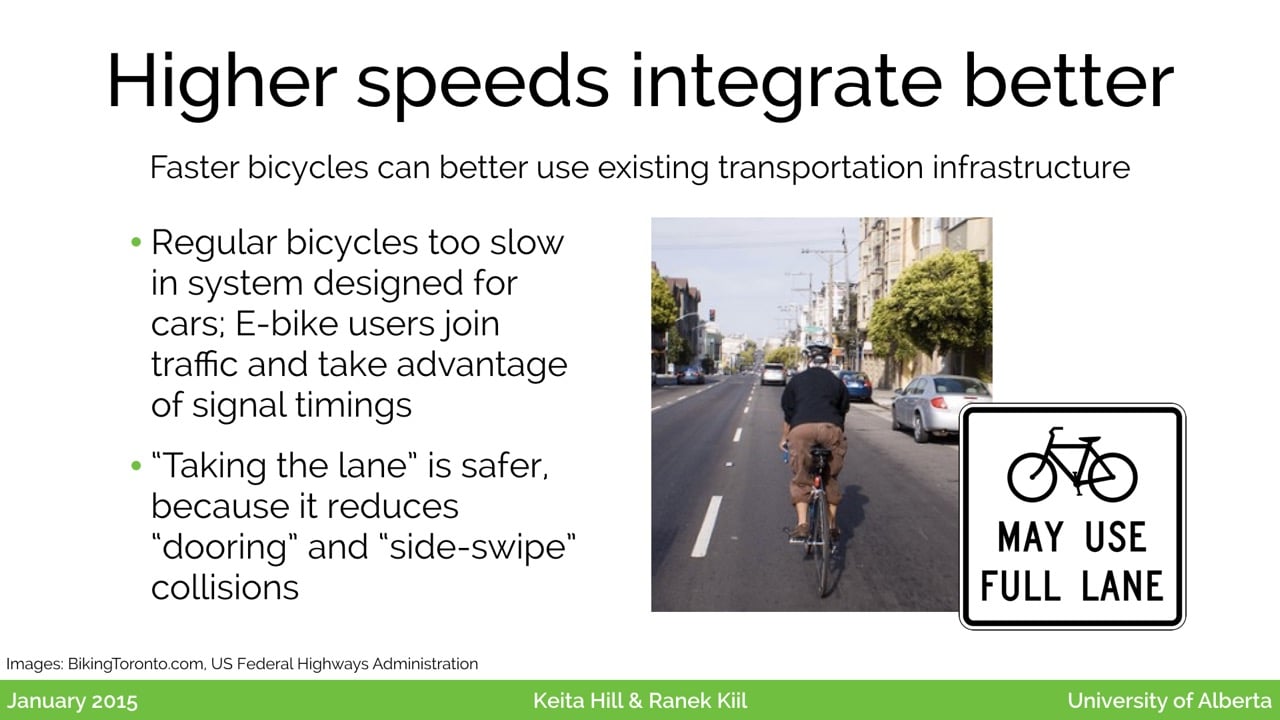
This might be a bit counter-intuitive, since you do travel at much faster speed, but it’s important to remember that the existing transportation network in most of North America is designed for quick moving cars and motorcycles. Being able to accelerate more quickly helps integrate better with traffic, which is an important adoption factor, because of course it’s not feasible to just tear all the streets out of all of Canada’s cities just because there’s a new technology we want to begin using.
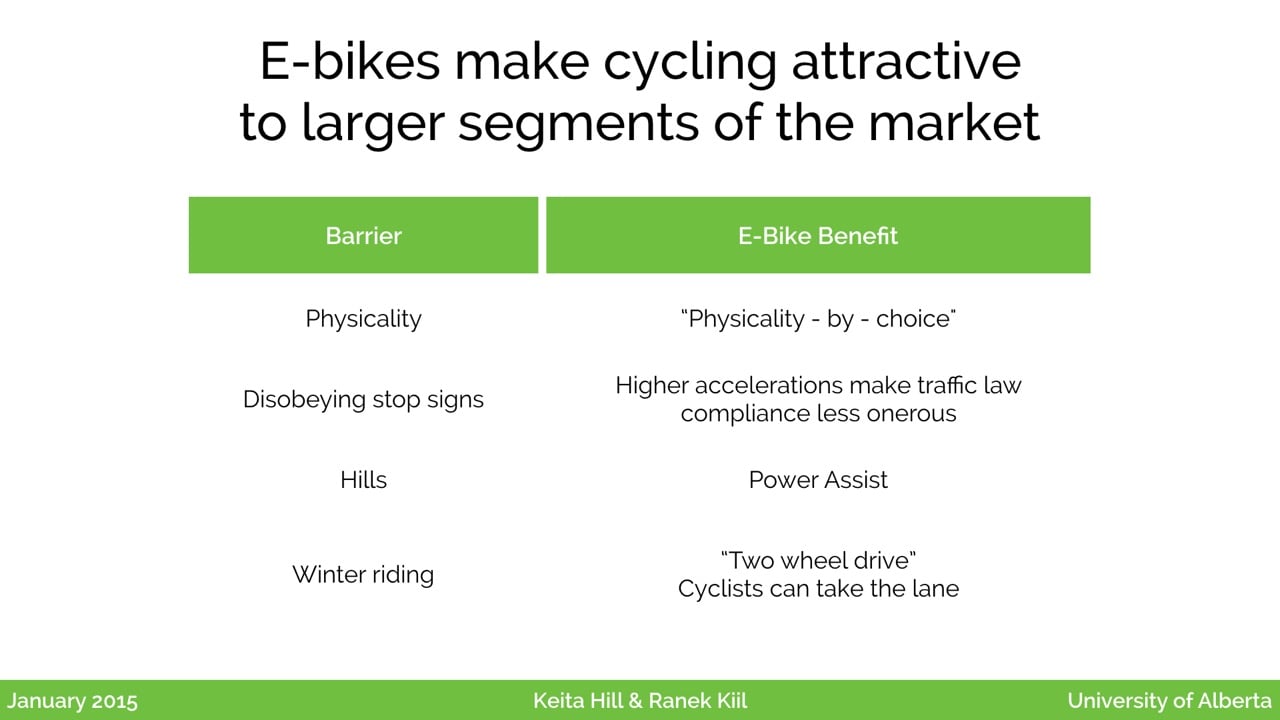
When we look at the list of key things people complain about if we suggest, say, that they cycle to work, there’s the physicality, which electric bicycles reduce, because you can just turn up the throttle if you don’t want to do as much work. This is especially valuable in a hilly city, like here in St. John’s, where you can use the power of the electric motor to help you up hills, but still get the benefits of additional exercise on the flatter parts of your route. We also find that there’s a higher level of obedience at stop signs, because you’re able to accelerate more quickly, which also helps cyclists integreate better with car drivers. Finally, there are benefits for winter cyclists; in a snow city like Edmonton, you’re able to take the lanes that have been cleared, instead of being forced to the side of the road, where there is often a snow bank.
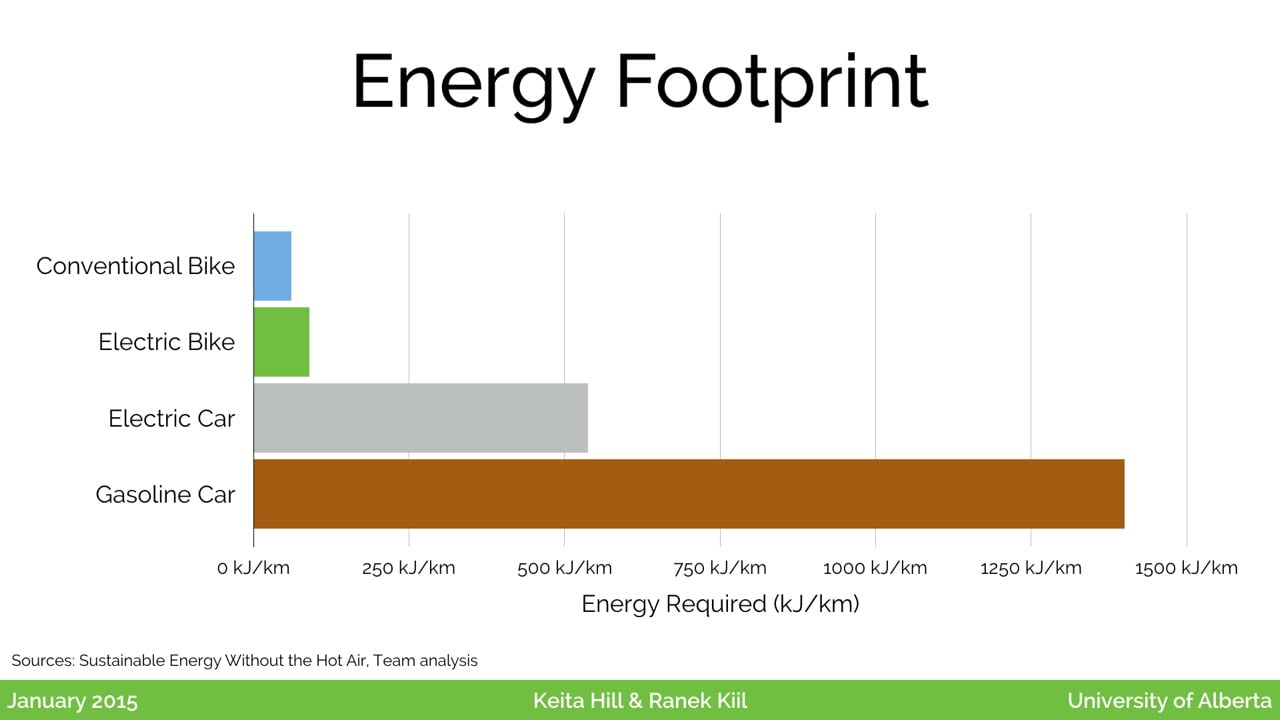
And of course, there is the energy efficiency component. If we look at this chart, we can see that electric bicycles are very efficient compared to larger vehicles, and of course, there is a huge difference between the efficiency of an electric bicycle and a traditional gasoline-powered automobile.

What we’d like to talk about now is the value proposition for individuals. That is, what are some of the factors that individual citizens will use to decide whether to adopt electric bikes?
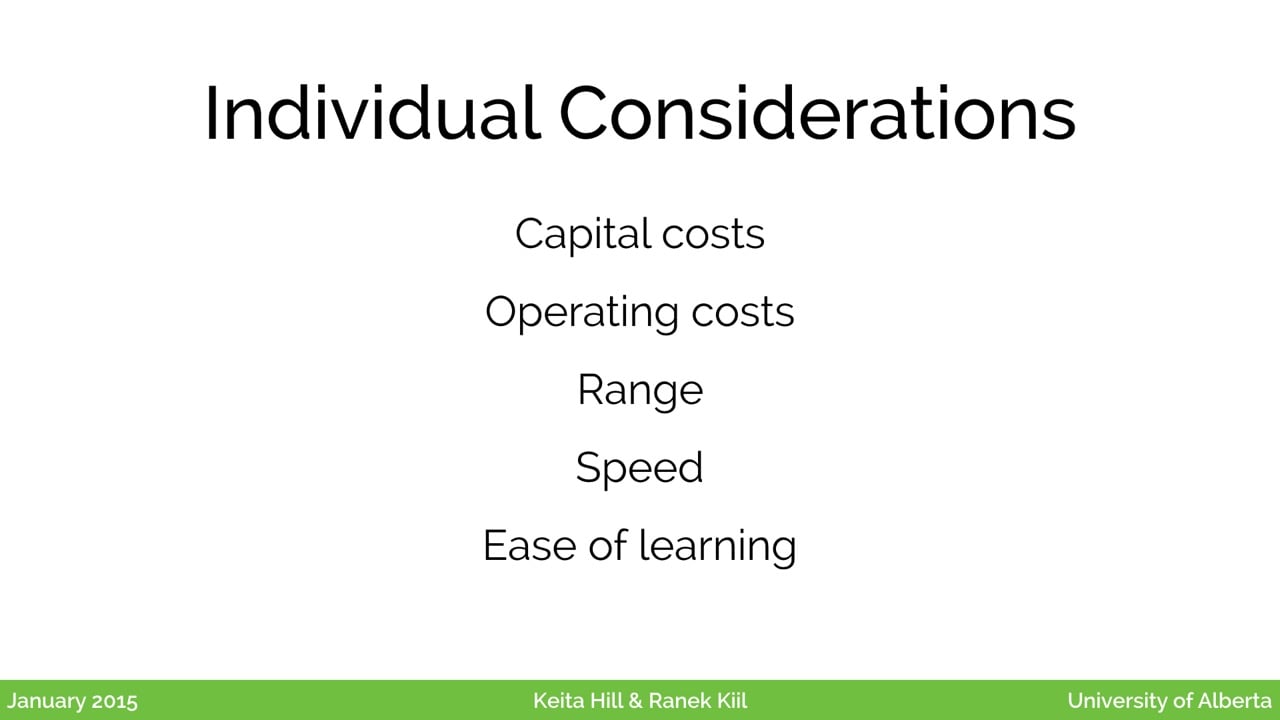
We considered five: cost, both operating and capital; range; speed; and ease of learning. Let’s go into a little more detail on each of those.
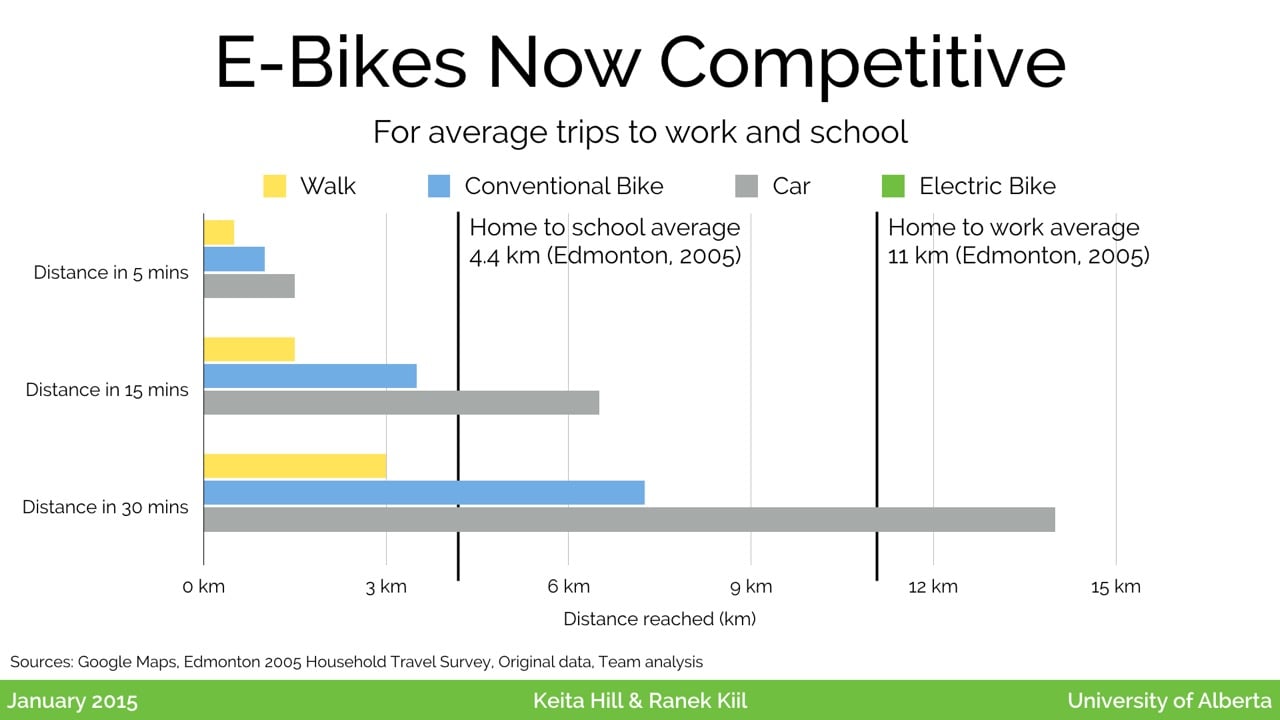
One of the most important factors, in order to build a usable mode of transportation, is that it have a far enough range to be able to get to work or school. We considered two types of trips in Edmonton: home-to-school, which is an average of 4.4 kilometres, and home-to-work, which is an average of 11 kilometres. We looked first at how the existing forms of transportation stack up, in terms of the total time they take to reach those distances. You can see that we’ve graphed three time horizons: five minutes, fifteen minutes, and thirty minutes. For the trips to school, you can see that while conventional cars can reach the average school within fifteen minutes, the bicycle is unable to, and for trips to work, the same thing is true. While the average commute via car is about a half an hour, the cyclists are going to require closer to an hour to make that trip, making it quite a bit less viable for most people.
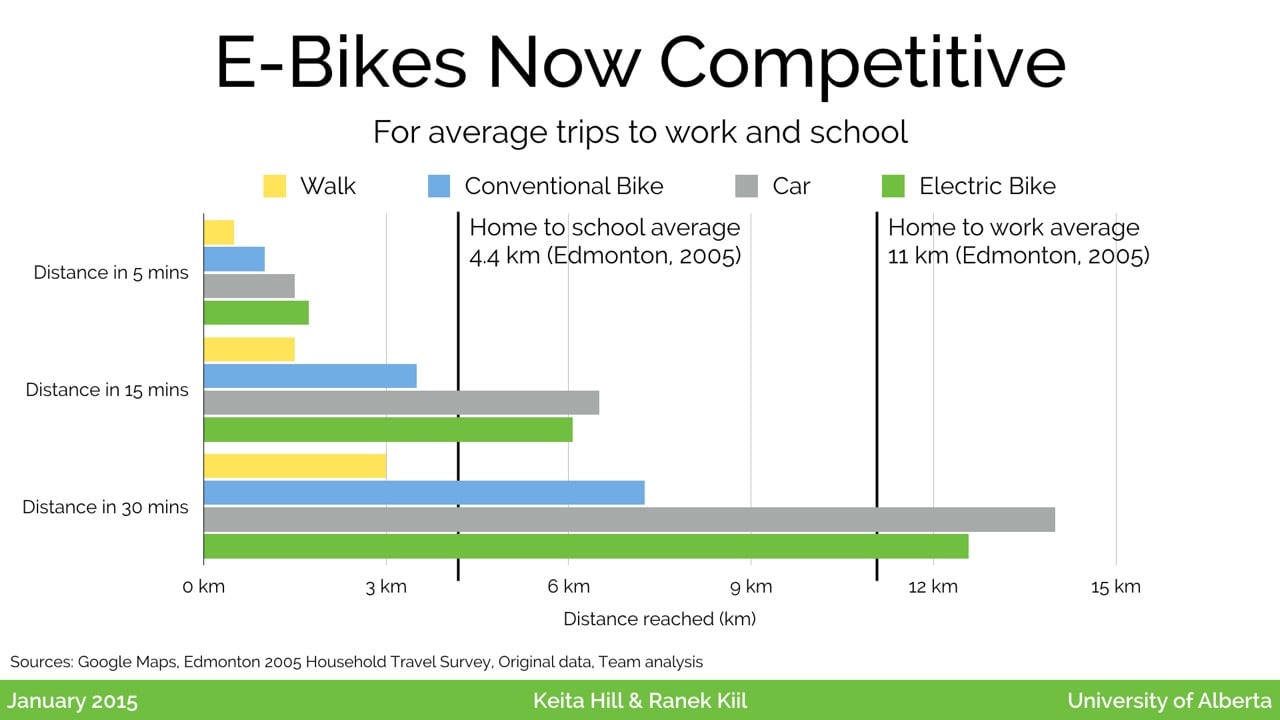
When we add the electric bike into the picture, we can see that it competes, at least in urban areas, quite well with the car. For the average type of trip we considered, this makes the trip possible in the same general time frame — school commutes within fifteen minutes, and the average work commute within half an hour.

When we look at the impact that has on a city, we looked here are St. John’s,4 and we ran a simulation to see how far you can get in fifteen minutes by conventional bike, versus electric bike. So this inner region, in blue, is the range you can reach by conventional bike, pedalling at about sixteen kilometres per hour. Now, the electric bike, out here, lets you cover three to four times the area. This shows you the effect this technology can have on the number of people who might consider a bicycle a viable option.
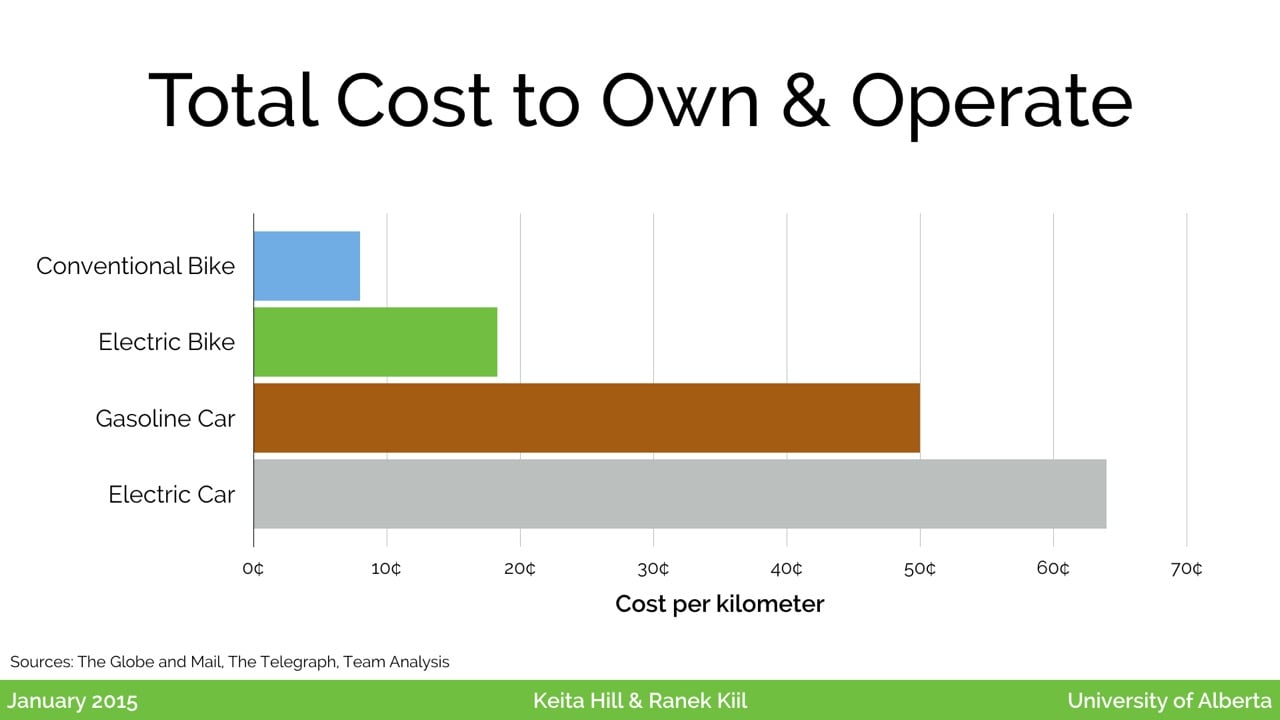
We’ll also look quickly at the cost to own and operate these vehicles. We took a look at the lifetime costs of each of these four modes of transportation. Here, you can see the conventional bicycle costs about eight cents per kilometre to run, operate, and own. When we compare that to the car, you can see that cars cost close to fifty cents, and today electric cars are a little higher, at about sixty-five cents, due to the higher capital cost.
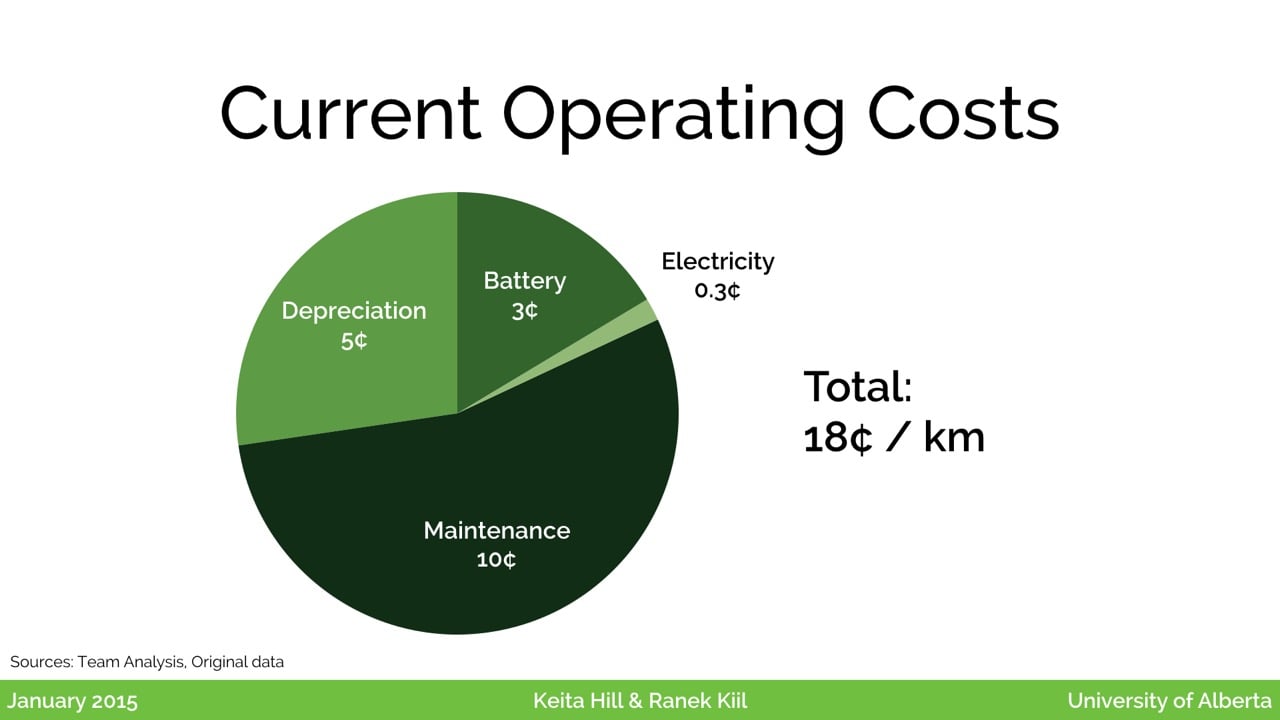
In comparison, the electric bike costs about eighteen cents. When we break that down, we find that the majority of that is for maintenance and depreciation. So, over three quarters of the costs are actually in the bicycle itself. If we can reduce those costs of building and owning the bike, that can make it an even more viable option. Batteries are interesting. You can see here that the electricity cost is only about a third of a cent per kilometre, while the battery cost is roughly ten times that, to reflect the fact that lithium-ion batteries have a limited number of charge cycles. In our research, we find that after five hundred charges, the capacity is highly diminished, so the battery probably needs to be recycled at that point, making that cost quite a major one at this time.
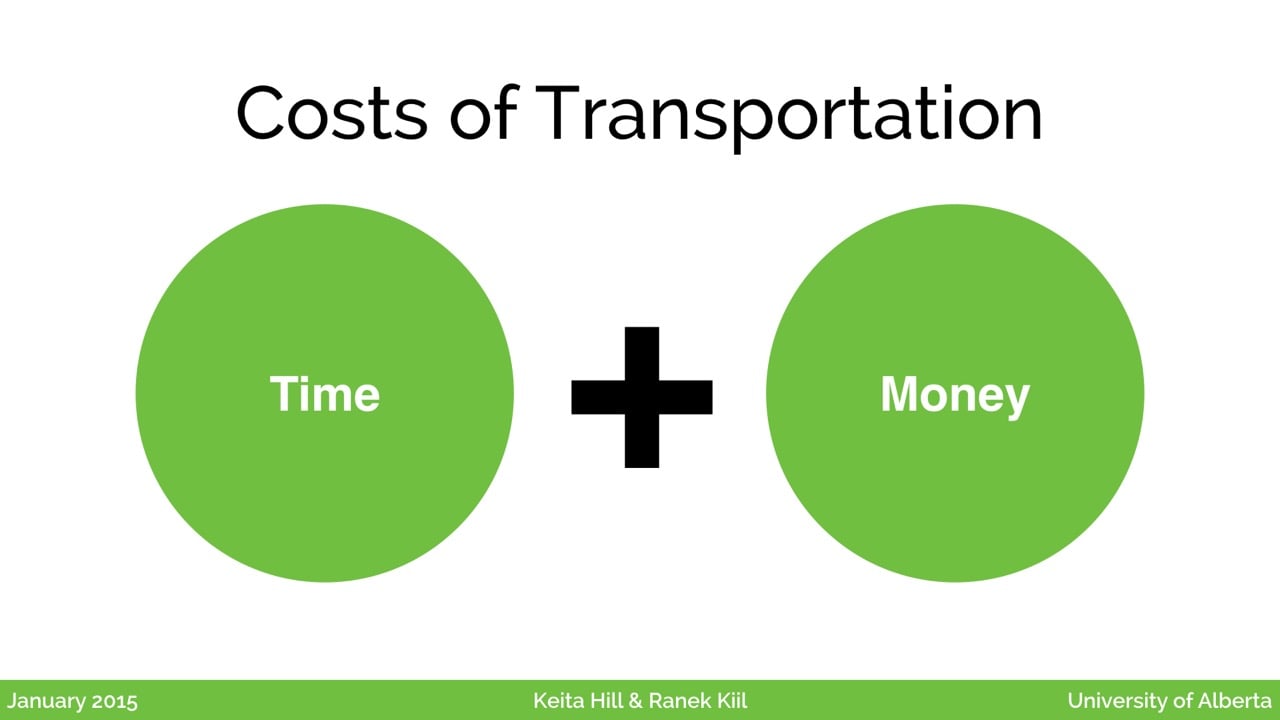
When we looked at the costs of transportation, we did a thought experiment, and looked at what things one gives up to overcome one kilometre of distance. So, if we say you’re trying to get from A to B, perhaps to work or school or a store, what are the costs that we have? We say that in order to get from A to B, we’ve had to give up some combination of our time, and we’ve also had give up a certain amount of money.
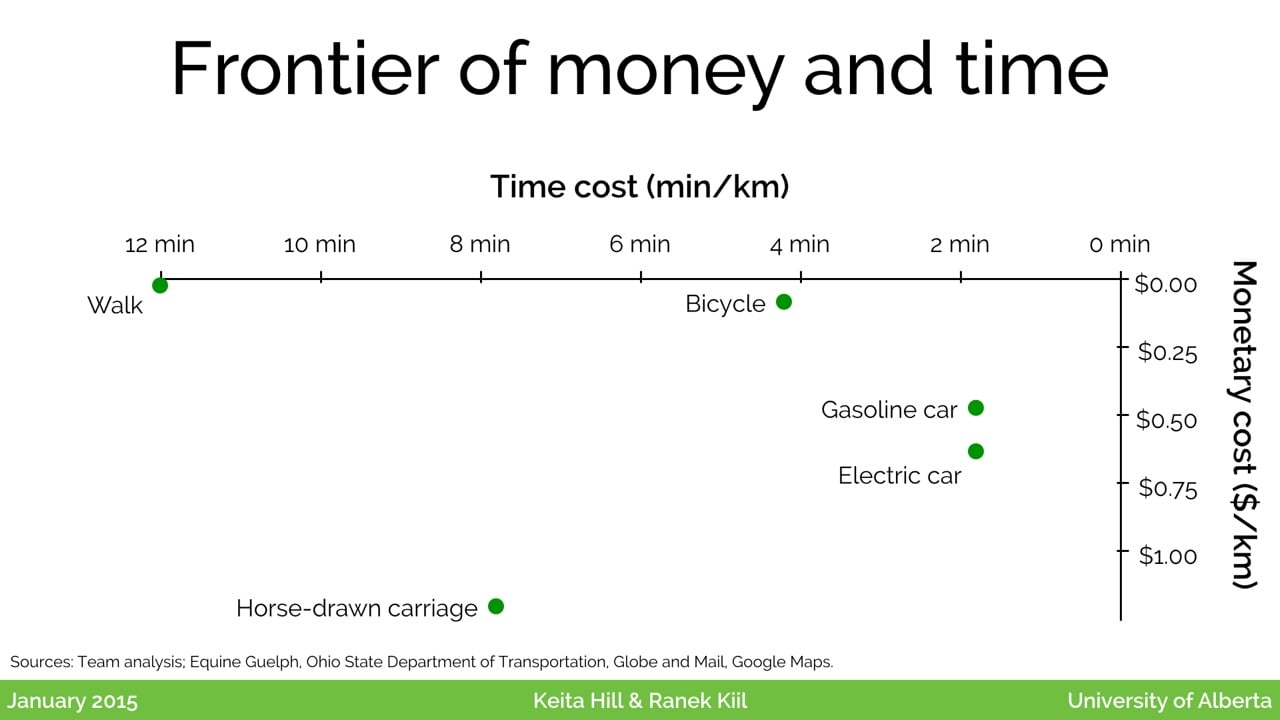
We actually looked at several different existing forms of transportation, and graphed these. We put the time cost on the x-axis, from zero minutes to twelve minutes, so we can see that walking costs a fair bit of time, since it’s slow, but there is a very low monetary cost — basically the cost of some food. From there we compared expensive but slightly faster methods like horse-drawn carriages, and traditional bicycles, which are fairly cheap, but also a bit slower than cars.
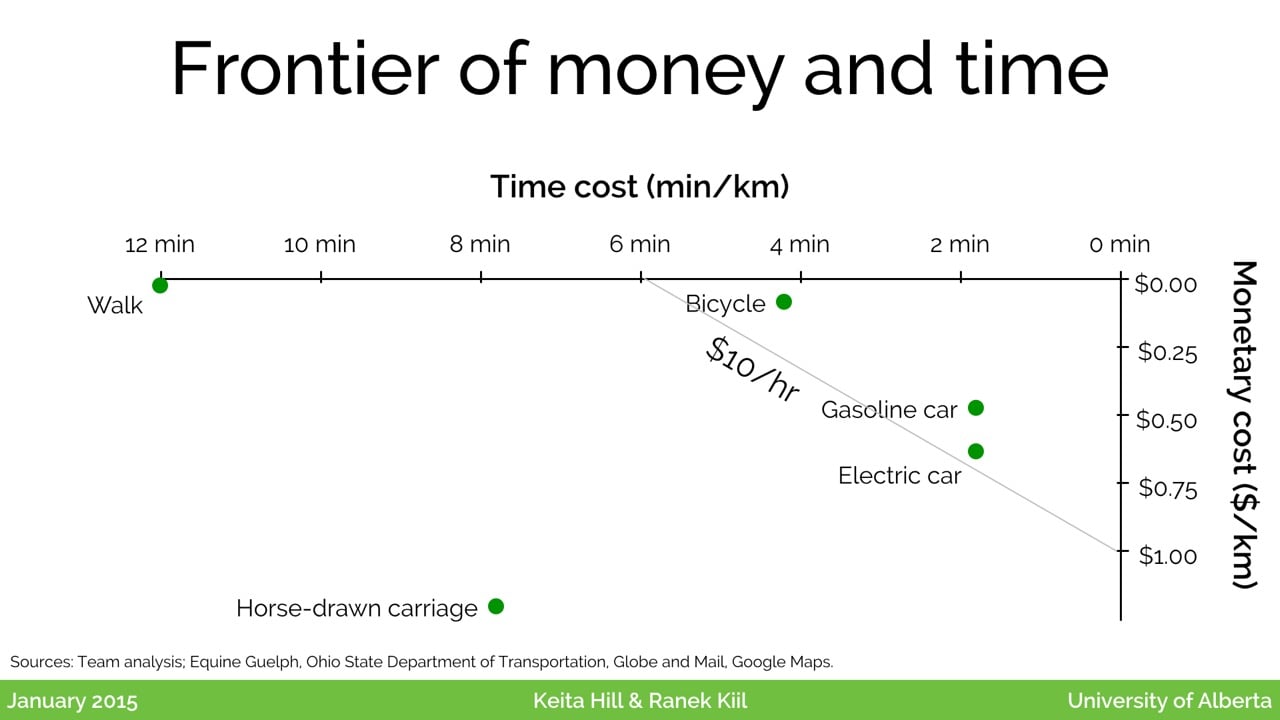
So that’s the picture we see today. Of course, the next question is: where does the electric bike fit into this picture? In order to understand that, I’d like to talk about the idea of there being a frontier on this diagram. Everyone is familiar with the saying that “time equals money”, but everyone has a different idea of how much their time is worth. Suppose we draw a line at ten dollars an hour — that connects one-tenth of an hour, or six minutes, with one dollar.
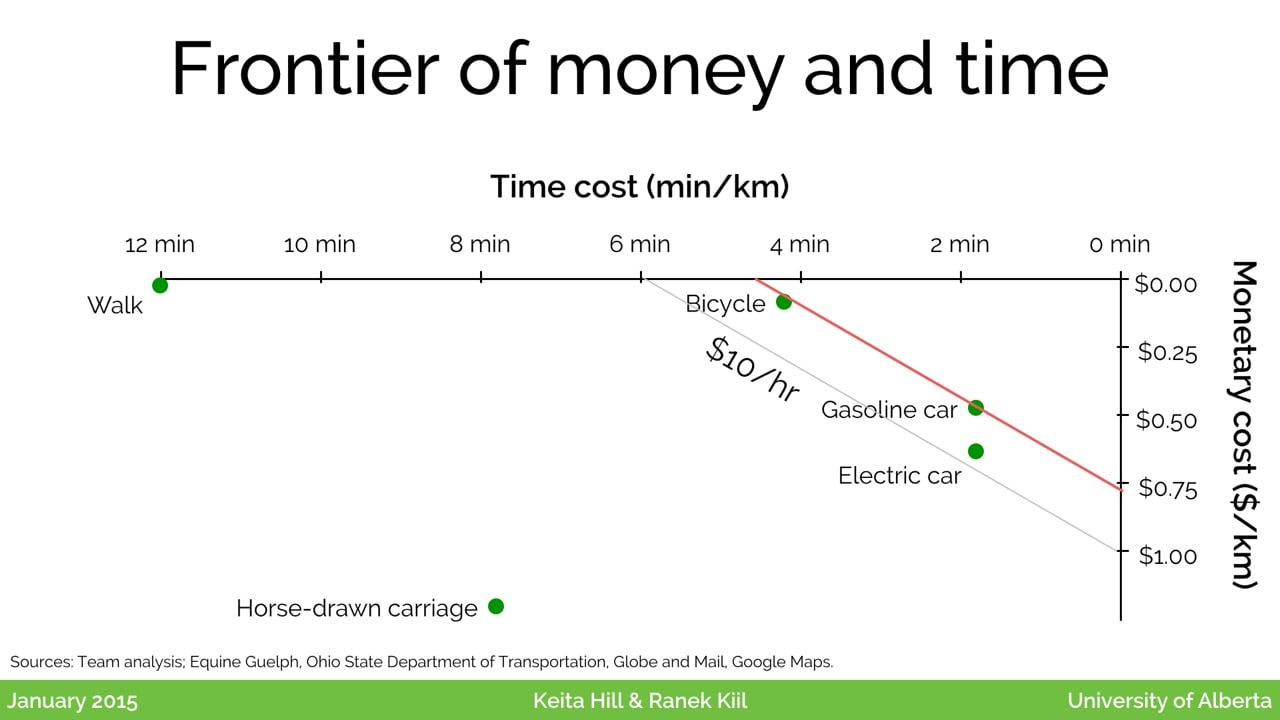
That means, that if you value your time at ten dollars per hour, all the points along this slope are equally attractive to you. Thus, for someone valuing their commute time at $10 per hour, the gasoline car is just a bit better than the bicycle.
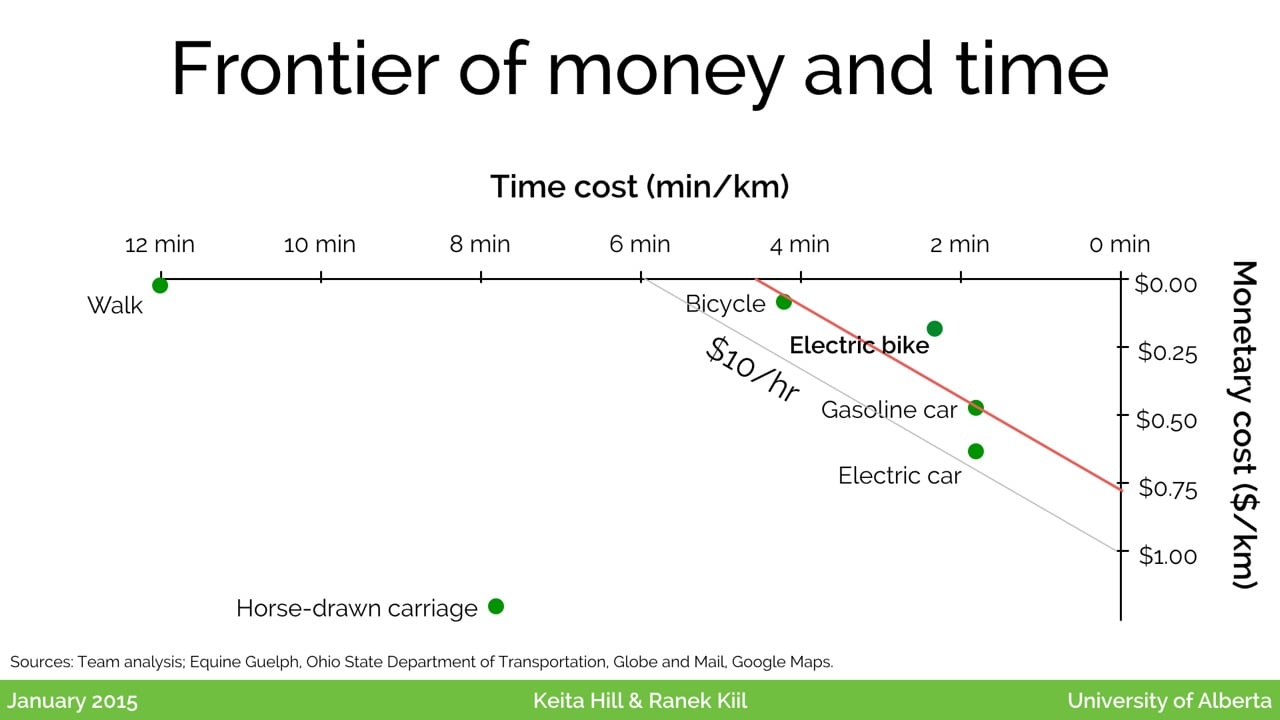
When we add the electric bicycle into the picture, we can see that it is now surpassing that frontier. And if we use this technique to compare time and money value, we can adjust the slope to find out the maximum time value at which that remains true.
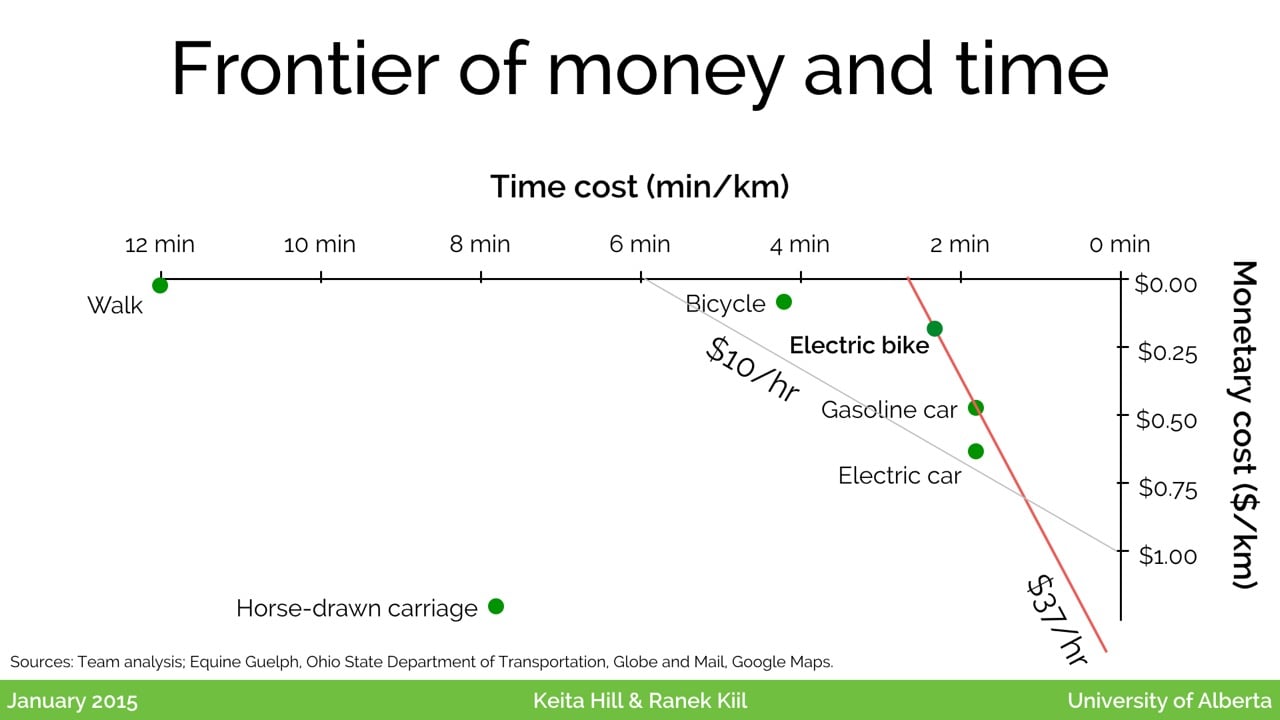
If we turn this slope, we actually find that for anyone valuing their commute time at less than $37 per hour, the electric bicycle is now theoretically, that is, of course, neglecting weather and other factors, the preferred mode of transportation. We find that very exciting, that this is actually surpassing an existing frontier.

With that, we’ll talk about some of the other factors we want to consider.

So there’s a quick aside we want to make, which is basically to look at the idea of “utility” from an ECON 101 textbook. Utility is the ability to satisfy one’s wants or needs.
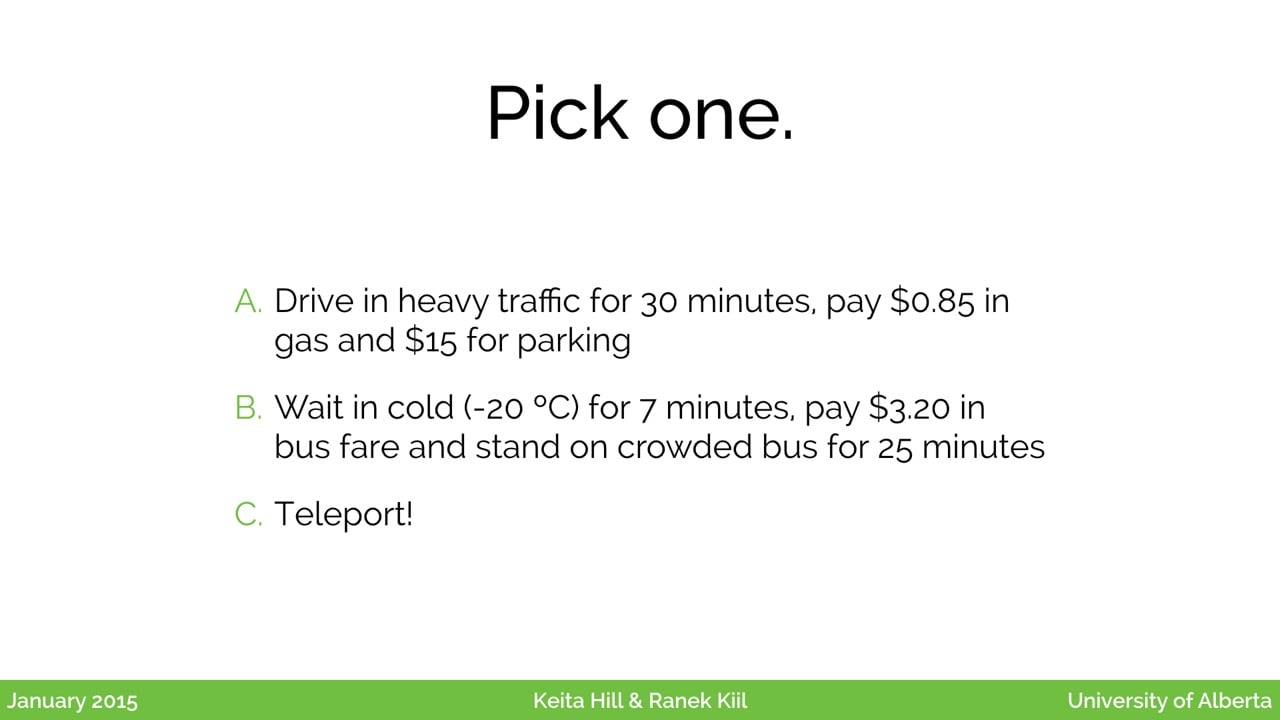
In the context of transportation choices, if you give someone options like driving (plus paying for parking), waiting in the cold in exchange for a cheap bus ride, or just magically appearing somewhere, generally, people will choose the teleportation option — all the other options get in the way of them reaching some goal like socializing with friends, pickup up groceries, or getting to work.
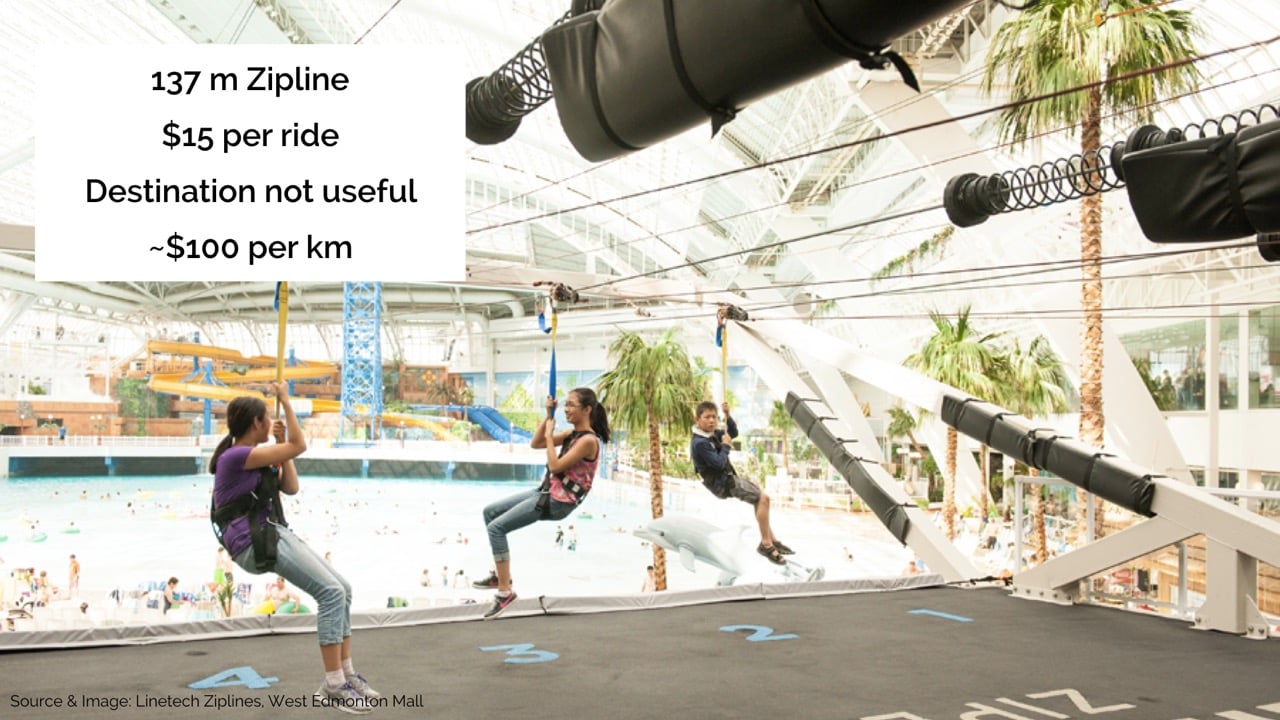
But there are some situations where this isn’t the case — where people associate some positive value with a transportation choice. We thought this was sort of fun: in Edmonton, at the West Edmonton Mall, there’s a 137 metre zip-line, and people will pay $15 to ride across the mall. This destination is not “useful”, but they pay what works out to about $100 per kilometre for this trip.
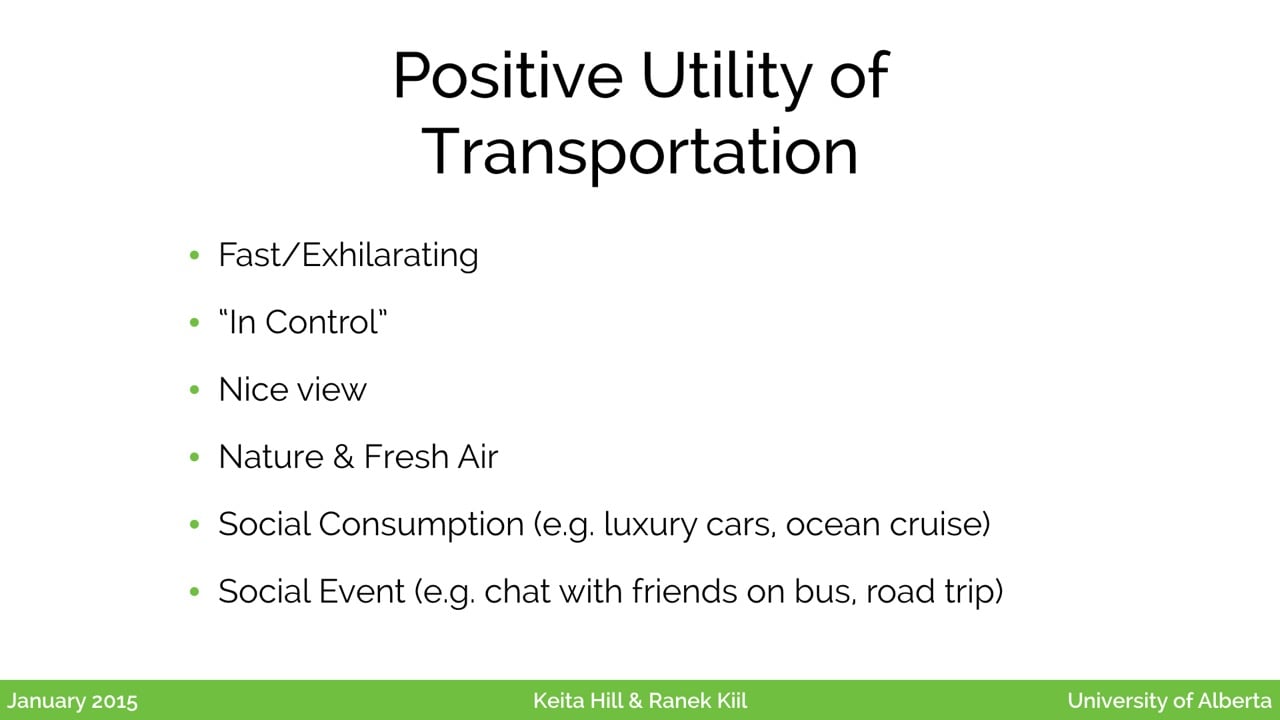
Some of the factors that make a transportation experience have positive utility include the experience being fast or exhilarating, giving the feeling of being in control; people who hike might like a nice view, nature, or fresh air; there are social consumption factors that drive purchases like luxury vehicles, cruises, limousine rides; and there are social events, like going on a road trip or choosing a public transportation option that allows you to more freely chat with friends along the way. We think that several of these same advantages apply as positive values of electric bicycles as well. We know this is already the case because many people already cycle recreationally or for leisure, because there are benefits to them besides just the cold economic factors we’ve discussed.

So there are a number of opportunities we see, where we think the next generation of entrepreneurs in the electric bike space will be able to make inroads and increase the adoption of these vehicles.
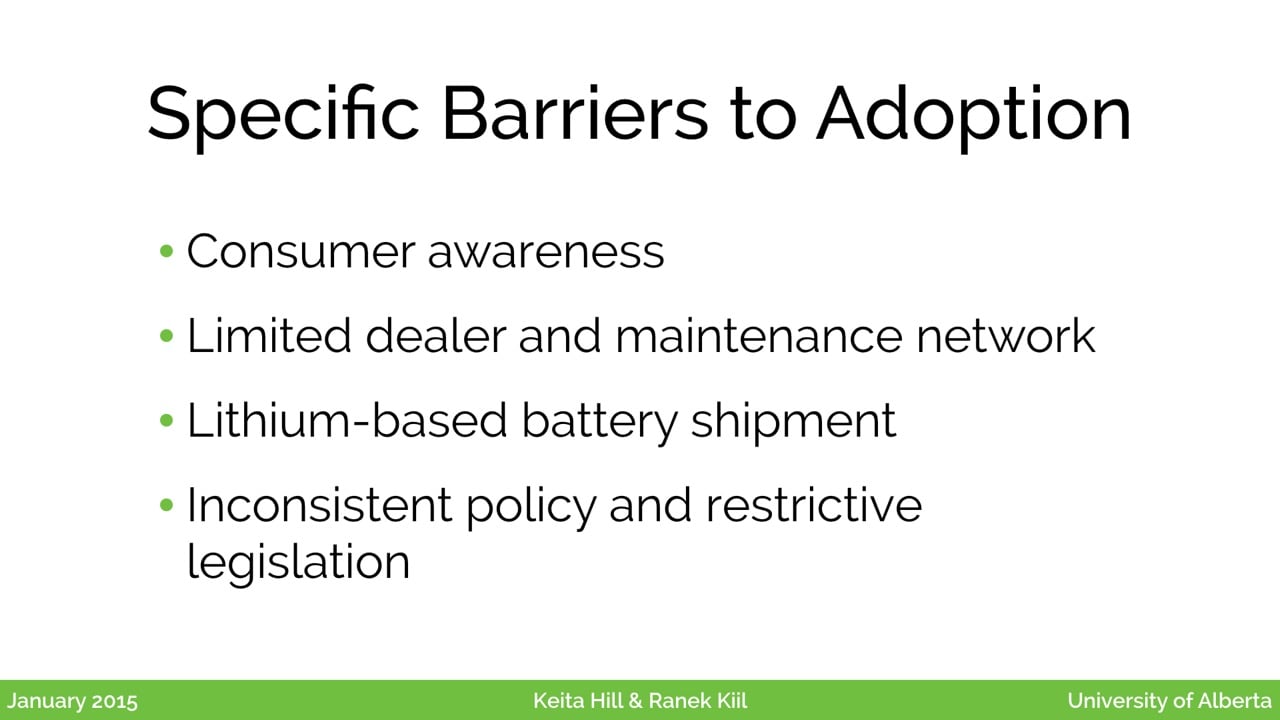
We’d like to talk about a few major ones now, including consumer awareness, maintenance networks, battery issues, and legislation.
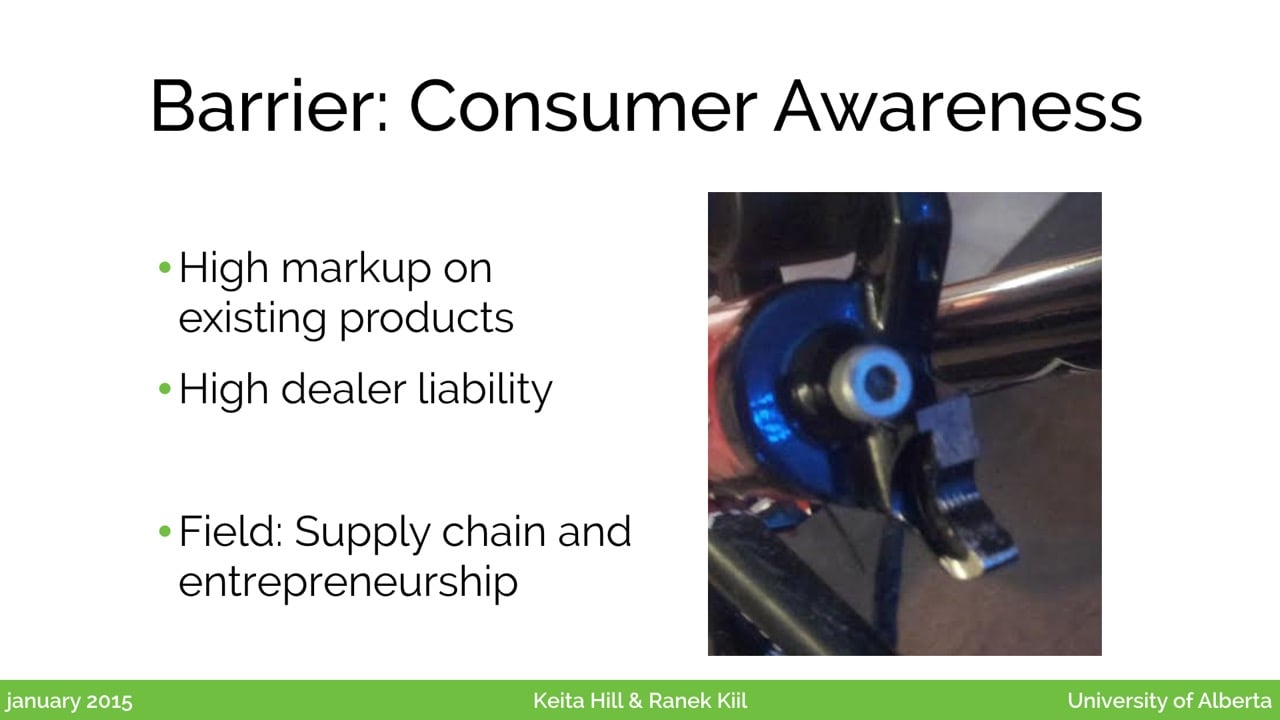
The first is consumer awareness. If we look at existing products, we see that many of them have a fairly high markup. This is driven in part by high liabilities on dealers and a lack of expertise.
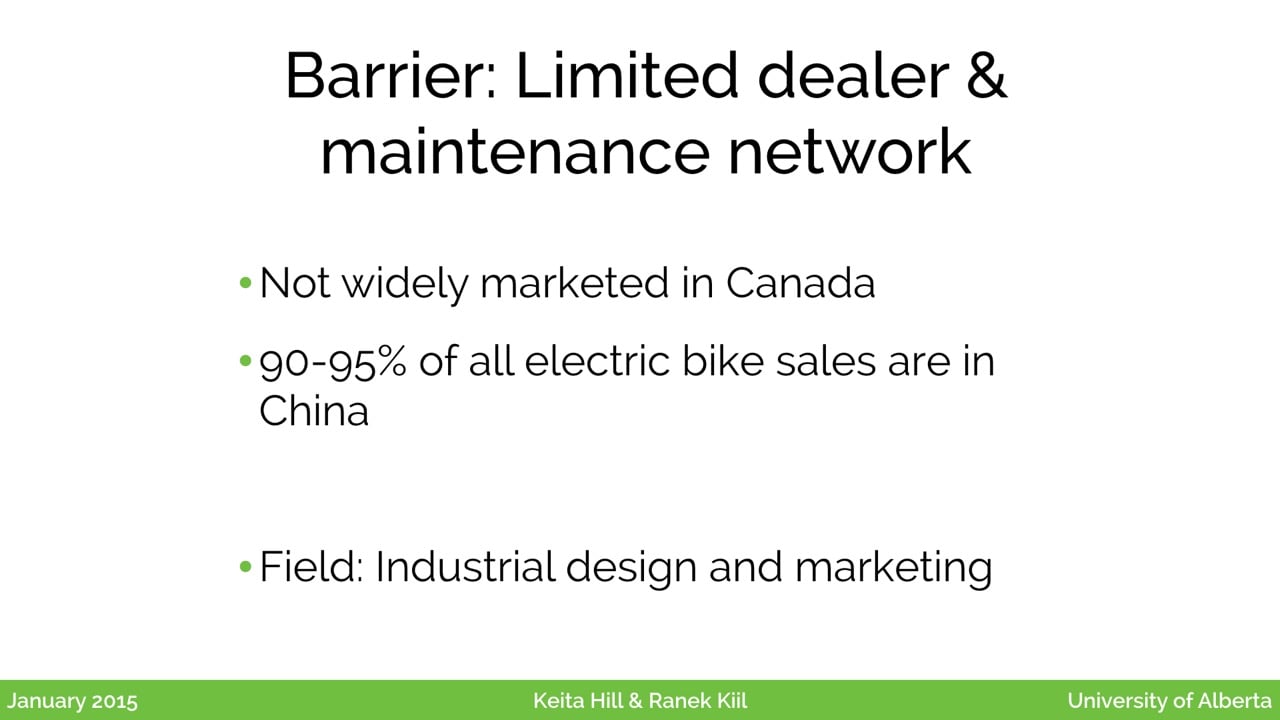
As a result, we can see opportunities to improve the supply chain, and also to increase consumer awareness of the products. Here in Canada, electric bicycles are not widely marketed, and that current sales figures have over 90% of electric bicycles sold in China. This goes to show that one market, with a very efficient supply chain, has seen adoption, while the rest of the world has yet to catch on with this technology.
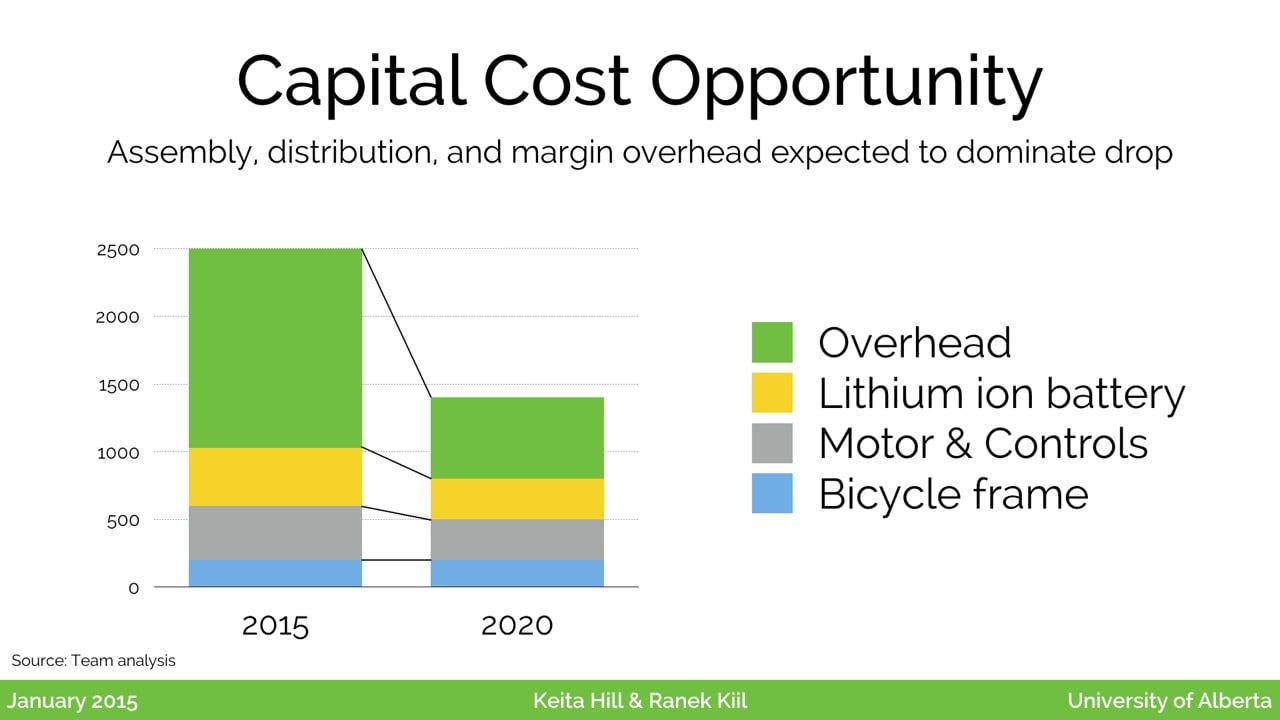
There’s a huge opportunity here. If we look at the markup taken by the final retailer, and estimate this dropping down close to the markup on conventional bicycles, which is about 35%, and model the decreases in the other cost components, we can expect that in 2020, the cost of an electric bike — like the one we showed earlier, with at fifty kilometre per hour speed and seventy kilometre range — could fall from $2500 to close to $1400. This is a significant drop.

Another barrier is that lithium ion batteries are quite sensitive to shock, which has led to there being barriers on their transportation by air.
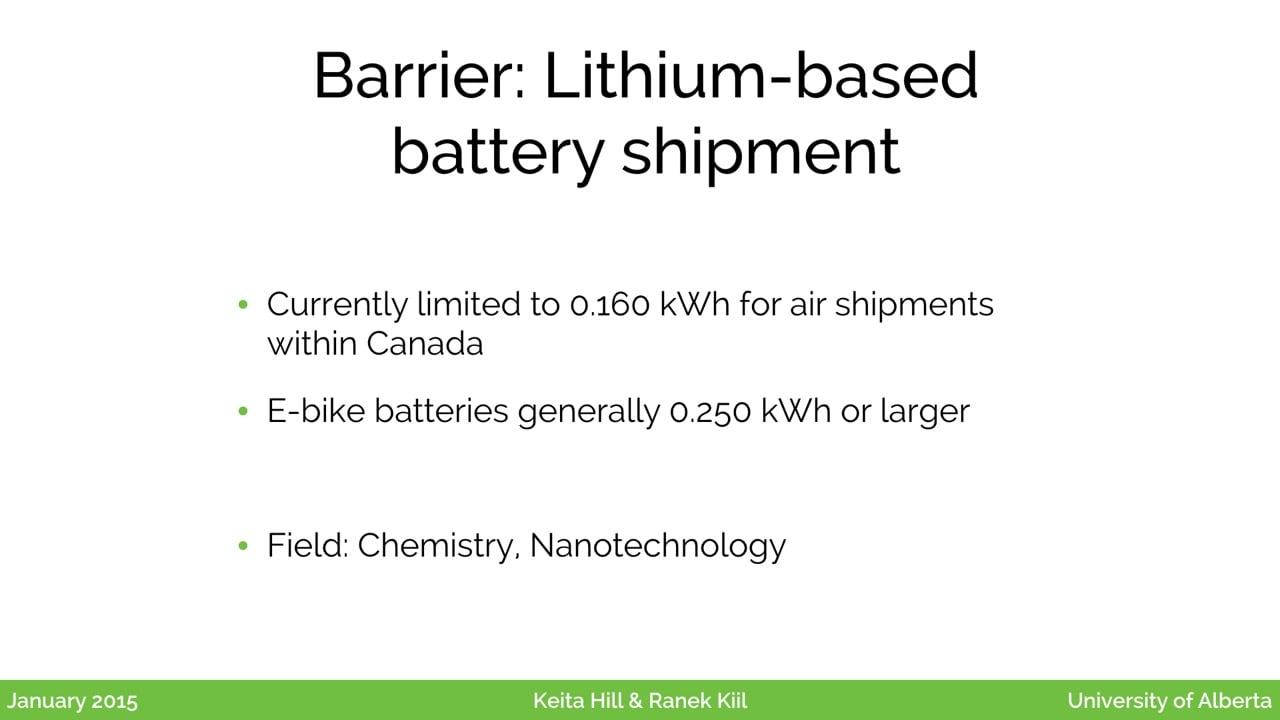
This is limiting the availability of the large batteries necessary for this technology, and making it difficult to distribute these batteries efficiently to consumers through the regular supply chain.
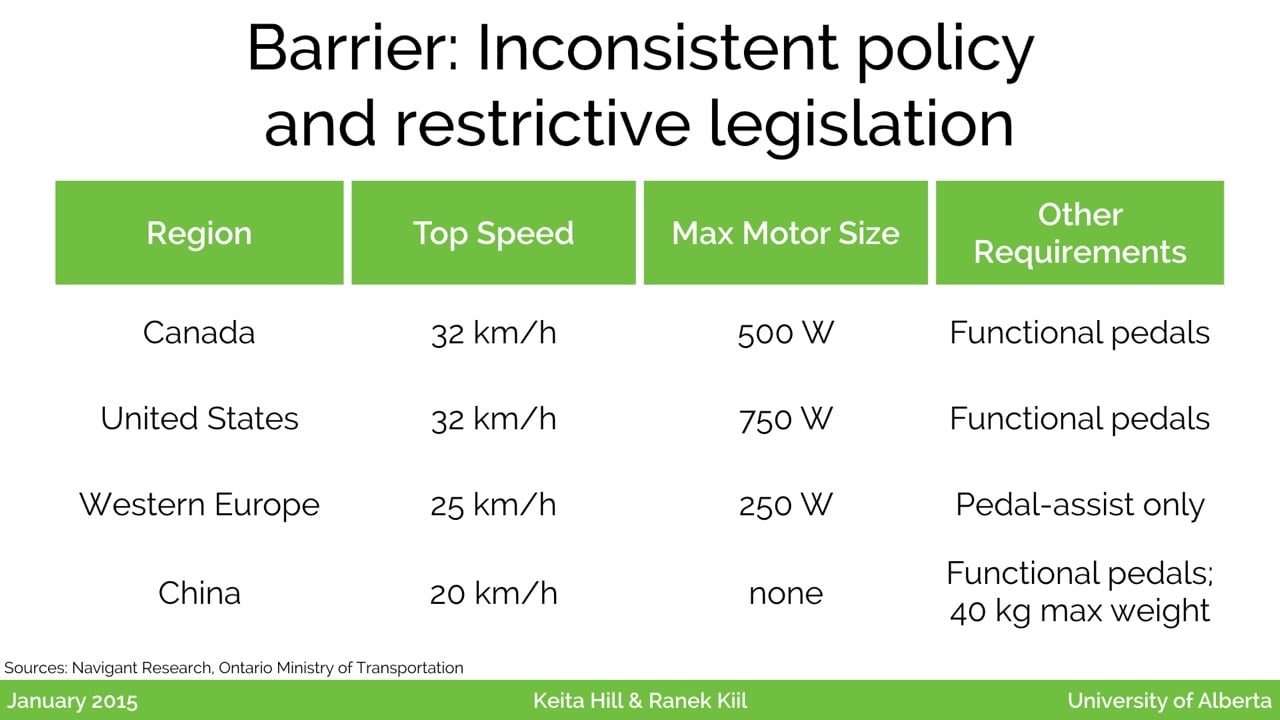
We’re also seeing some legislative barriers in Canada. In the USA, there are higher allowances for the maximum motor sizes; there are obviously areas to make this more accommodating of more powerful vehicles.
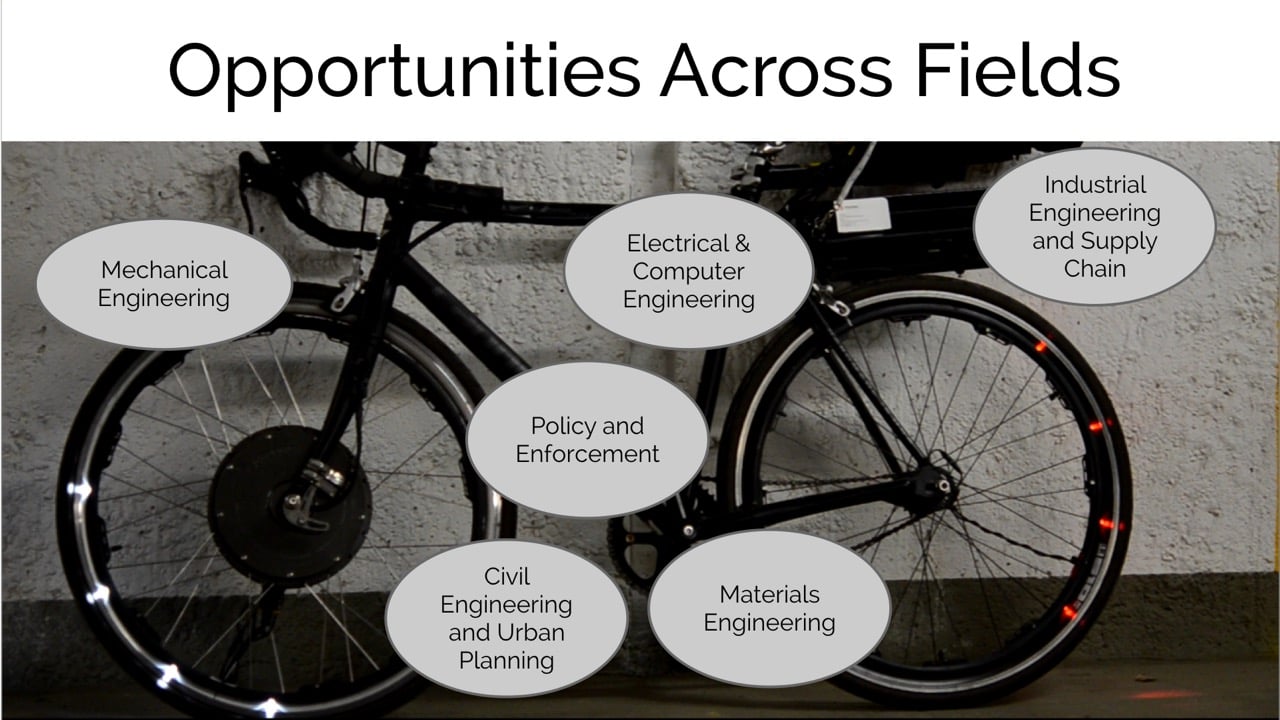
In summary, there are areas of opportunity across mechanical engineering, urban planning, electrical and computer engineering, industrial engineering, supply chain optimization, and more, and we hope that the next generation of entrepreneurs and innovators will strive to push this technology forward.

With that, we would be happy to discuss any of the assumptions behind our analysis, or take any other questions that you may have. Thank you very much!